In another truncated trading week due to a holiday on Thursday (May Day/Maharashtra Day), trading activity remained muted. FIIs remained net buyers during April ‘14; DII selling matched FII buying – unlike in March ‘14 when FII buying during the month was nearly double of DII selling. The effect can be clearly seen on Sensex and Nifty charts below. Monthly close of April ‘14 and March ‘14 were almost identical.
An unusually hot summer so far and the likelihood of El Nino has already caused food prices to move higher. Inflation is likely to start rising again. RBI will be forced to either hold interest rates or even raise them. Rate-sensitive stocks are already bearing the brunt of high interest rates. Auto sales in April were down. Commercial vehicle sales have not picked up. Economic growth will be a challenge for the new government.
Investors should concentrate on companies announcing their annual results, and look for those that are producing consistent and sustained performances rather than those that are declaring spectacular profits in the most recent quarter. Often the spectacular profits are due to one-offs or base-effect (i.e. poor profits in the year-ago quarter).
BSE Sensex index chart
The daily bar chart pattern of Sensex closed lower on all four days of the trading week, but found support from its 20 day EMA. The following comments were made in last week’s analysis: “Friday’s bar has formed a ‘reversal day’ pattern, which may lead to some correction or consolidation.”
Can the index correct some more? Daily technical indicators are suggesting so. MACD is positive but falling below its signal line. Note the bearish ‘rounding top’ pattern formed by the signal line. ROC has dropped into negative territory, but trying to move up. RSI is seeking support from its 50% level. Slow stochastic has dropped below its 50% level.
Investors appear a bit jittery about the election outcome even though every one is expecting NDA to form the next government. Remember that pollsters got it wrong in 2004 and 2009. So, it is better to err on the side of caution. In other words, continue with existing investment plans but refrain from making heavy bets – particularly on unknown stocks.
There will be plenty of investment opportunities in the market after May 16. Regardless of who forms the next government.
NSE Nifty 50 index chart
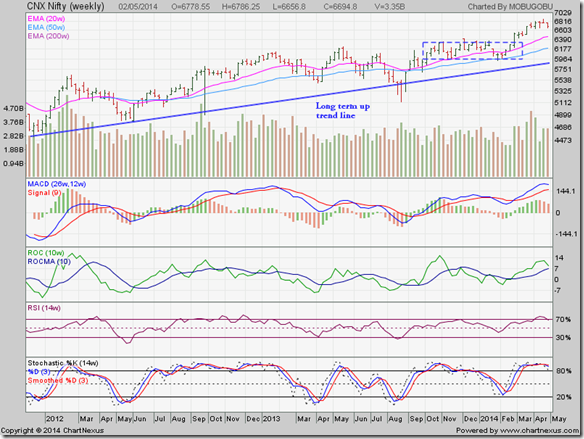
The weekly bar chart pattern of Nifty continued to struggle in its efforts to cross the 6800 level convincingly. Despite intra-week breaches, Nifty failed to close above 6800 on a weekly basis. The two weekly EMAs and the long-term up trend line (in blue) are rising and Nifty is trading above them. The long-term bull market remains intact.
Weekly technical indicators have begun to correct from overbought conditions. MACD is inside its overbought zone, but starting to turn down. ROC is about to drop from its overbought zone and cross below its 10 week MA. RSI has slipped down from its overbought zone. Slow stochastic is inside its overbought zone, but started to slide down.
Some more correction or consolidation is likely. Expect market volatility to increase as the election results date approaches. Ignore it. If any of your portfolio stocks suddenly shoot up, book part profits.
Bottomline? Chart patterns of BSE Sensex and NSE Nifty indices are undergoing mild bull market corrections. Despite an expected NDA victory, there is little euphoria in the market. That means a NDA majority can propel the indices much higher. Those who are in the market should stay invested with appropriate stop-losses in case there is a hung parliament. Don’t postpone your current investment plans.


No comments:
Post a Comment