Stocks from the infrastructure sector were in doldrums due to the economic slowdown, and had fallen to two year lows during the second quarter of 2013-14. The ground-swell from Modi’s campaign brought them out of bear markets.
Once the Modi government came to power, many infrastructure stocks rose spectacularly, and provided multibagger gains. However, during the past one year, there has not been much progress in disentangling of stuck projects or initiation of new ones. High interest rate also played spoilsport.
Earnings of infrastructure companies haven’t kept pace with their stock prices. While stock prices haven’t crashed, large-cap and mid-cap stocks are down from their two year highs, and have entered sideways consolidations. The stocks of L&T and JK Lakshmi Cement are good examples.
L&T
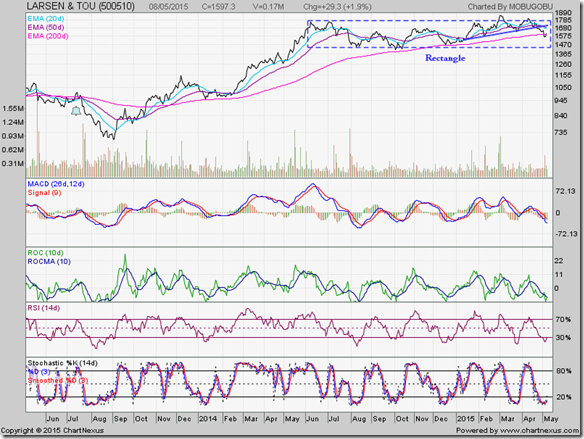
After a 1:2 bonus issue in Jul ‘13 (marked by bell on chart), the stock of L&T dropped to a low of 695 on Sep 3 ‘13. From there, it rose to touch a high of 1752 on Jun 9 ‘14 – a huge 150% gain in 9 months.
The stock has since been in a sideways consolidation within a ‘rectangle’ pattern. The stock broke out above the ‘rectangle’ on good volume support and touched a two year high of 1843 on Mar 2 ‘15. But it failed to sustain above the ‘rectangle’. It subsequently formed a ‘head-and-shoulders’ reversal pattern with an upward-sloping neckline within the ‘rectangle’, and corrected below its 200 day EMA.
Daily technical indicators are looking bearish and oversold. A pullback towards the upward-sloping neckline is a possibility. A ‘rectangle’ pattern is usually a continuation pattern – which means the eventual break out should be upwards. But there has already been a failed break out and a reversal pattern formation. It may be better to wait for upcoming annual results to decide whether to buy, sell or hold.
JK Lakshmi Cement
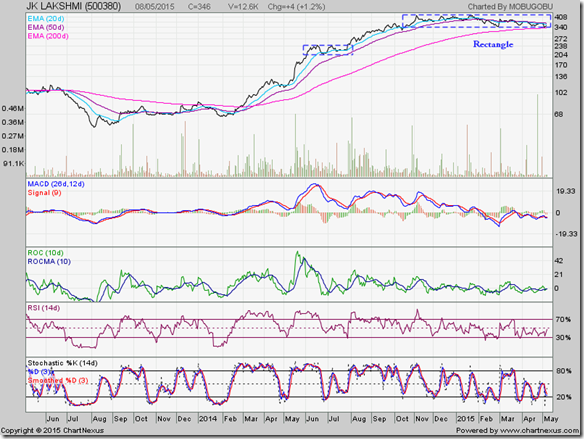
The stock of JK Lakshmi Cement rose from a two years low of 55, touched on Aug 5 ‘13, to a two years high of 407, touched on Jan 19 ‘15 – a whopping 640% gain in less than 18 months. The stock has been consolidating sideways within a ‘rectangle’ pattern with a downward bias since touching its Jan ‘15 high.
The stock is currently receiving twin support from the lower edge of the ‘rectangle’ (at 340) and its 200 day EMA. Despite the correction, valuation looks quite stretched.
Daily technical indicators are in bearish zones, but showing some upward momentum. A technical bounce is a possibility. Sequential QoQ results have shown decline in top and bottom lines for the past three quarters. Check annual results before initiating any action.


No comments:
Post a Comment