The automobile industry has been going through a period of transition and upheaval due to the overall economic slowdown. Lower oil prices have helped the industry. But withdrawal of excise duty concessions haven’t.
Commercial vehicle sales have just started to improve after a prolonged slump. Passenger vehicle sales are struggling. Even 2-wheelers (Royal Enfield aside) are troubled by poor rural sales.
It is no surprise that the 2 years closing charts of Exide and Hero Moto are reflecting the challenges being faced by the auto industry.
Exide
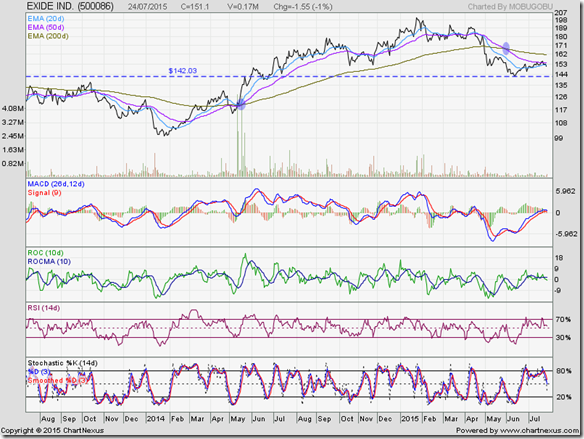
Exide’s stock touched a 2 years closing low of 100 in Jan 2014, before embarking on a strong bull phase that took the stock to a 2 years closing high of 198.70 in Jan 2015 – almost doubling in a year.
The stock has been in a correction since then, dropping to a closing low of 141.90 on Jun 12 ‘15 – retracing almost 58% of its bull rally and falling into bear territory.
The stock price has bounced up from the 142 level, but is trading below all its three EMAs. The ‘death cross’ (marked by light blue oval) of the 50 day EMA below the 200 day EMA has technically confirmed a bear market, but the bear phase may not last long.
Technical indicators are turning bearish, which can lead to a test of support from the 142 level. Exide is a market leader. The dip can be used to add, with a stop-loss at 138.
Hero Moto
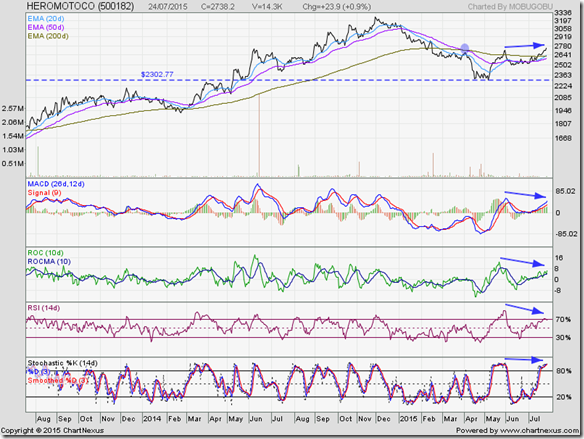
The stock price of Hero Moto formed a bearish ‘inverted saucer’ pattern from July 2013 to Feb 2014 and closed briefly below all three EMAs in bear territory.
Bulls used the dip to rally strongly. The stock price soared to a 2 years closing high of 3258 on Dec 1 ‘14 – gaining almost 70% from its Feb ‘14 low.
The subsequent correction dropped the stock price below all three EMAs into bear territory. The stock formed a ‘double bottom’ reversal pattern at 2300 and has closed above its three EMAs in bull territory.
All four technical indicators are in bullish zones, but showing negative divergences by touching lower tops (marked by blue arrows). The stock price may correct a bit before resuming its up move.


No comments:
Post a Comment