It was another holiday-shortened trading week that included an early F&O settlement on Wed. Apr 23 because Thursday was a holiday. That did not prevent Sensex and Nifty from touching new intra-day, intra-week and closing highs.
Many small investors are worried about the sustainability of the rally. Is it a good time to book profits or should one hold on till the election results come out? What if the market crashes after May 16? What if there is a 2009-like ‘gap’ up surge?
There is a simple answer to these questions: Worry about things you can control – like your own portfolios. If you can’t stomach a 20-30% correction, you should not invest in stocks. Corrections should be welcomed as buying opportunities since both indices are in bull markets.
Have that ‘missed-the-bus’ feeling? Not to worry. More buses will be arriving soon. Q4 results announced so far show that the usual suspects – IT services, private banks - are doing well. Pharma and FMCG should announce decent results as well. Those are the buses to get on.
BSE Sensex index chart
Daily bar chart pattern of Sensex touched new lifetime intra-day and closing highs during the week. However, Friday’s bar has formed a ‘reversal day’ pattern, which may lead to some correction or consolidation. All three EMAs are rising and the index is trading above them. The bull market is under no threat.
Daily technical indicators are correcting from overbought conditions. MACD is below its falling signal line and about to drop from its overbought zone. ROC is touching its 10 day MA in positive territory. RSI is falling towards its 50% level. Slow stochastic is ready to drop from its overbought zone.
All four indicators are showing negative divergences by failing to touch new highs. But a deep cut is not expected. FIIs were net buyers on all four days of the week. DIIs were net sellers of an equal amount.
NSE Nifty 50 index chart
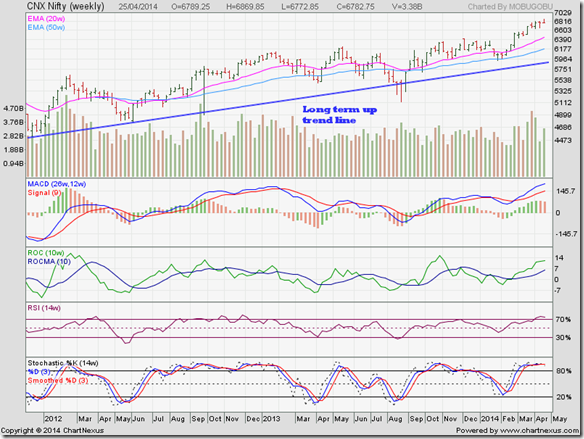
Weekly bar chart pattern of Nifty is struggling a bit near the 6800 level, though the index did touch new intra-week and weekly closing highs. The long-term up trend line and the two weekly EMAs are rising, with the index trading above them – which is the sign of a long-term bull market.
Weekly technical indicators are inside their respective overbought zones and not showing any inclination to climb down. That doesn’t mean a correction can’t happen at any time. Be prepared for it but don’t worry about it.
As mentioned in last week’s post, markets can remain overbought for long periods. So, selling now in the hope of buying back at a lower price later may not be a good idea. However, part profit booking and investing the proceeds in fixed income – i.e., if your asset allocation plan demands so – is always a good idea.
Bottomline? Chart patterns of BSE Sensex and NSE Nifty indices continue to touch new highs. Still many small investors are staying away from the market. That means the indices are likely to go even higher! Those who are in the market should stay invested with appropriate stop-losses. Continue with your SIPs in funds and use any dips to add.


No comments:
Post a Comment