Gold chart pattern
The daily bar chart pattern of gold shows the effect of a strong US Dollar on gold’s price.
After a struggle to stay in the zone between 1070 and 1080, gold’s price dropped to 1050 – a level not seen since Nov ‘09.
There was a bounce back and a close above the 1060 level, but on weak volumes. Probably some shorts got covered.
All three EMAs are falling, and gold’s price is trading well below them in a bear market.
Daily technical indicators are in the process of correcting oversold conditions, but remain deep inside bearish zones.
Is this an opportunity to do some bottom fishing? The fall during Nov ‘15 has been a bit steep. That can lead to a short covering rally.
There are no signs of a bottom formation yet.
On longer term weekly chart (not shown), gold’s price is trading well below its three weekly EMAs in a long-term bear market. MACD is falling below its signal line in negative zone. RSI is below its 50% level. Slow stochastic is inside its oversold zone.
Silver chart pattern
The following comments appeared in the previous post on the daily bar chart pattern of silver:
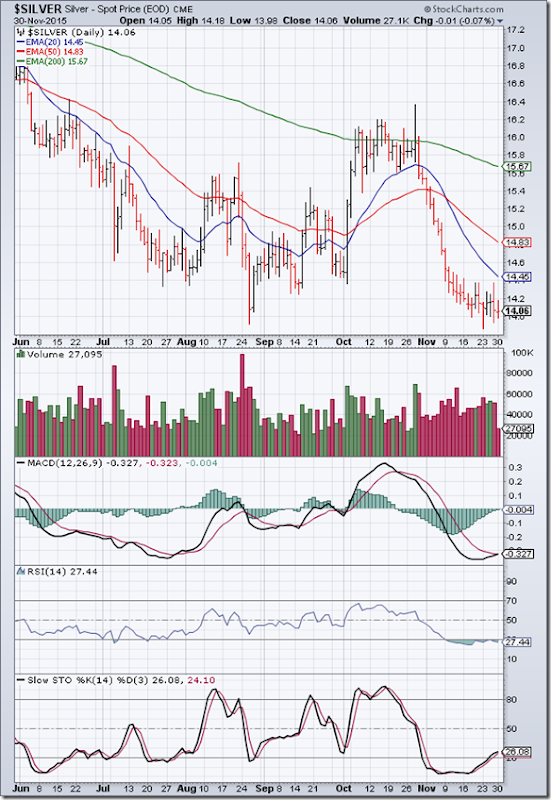
“Silver’s price is trying to cling on to its Sep ‘15 low of 14.25 – but not for much longer. A test and breach of the 14 level seems imminent.”
Silver’s price dropped below the 14 level intra-day, and briefly tested the Aug ‘15 low of 13.90 before managing to close just above 14.
Silver is trading below its three EMAs in a bear market. Daily technical indicators are trying to correct oversold conditions, but remain inside bearish zones.
On longer term weekly chart (not shown), silver’s price is trading well below its three weekly EMA in a long-term bear market. MACD is sliding down below its signal line in negative zone. RSI is moving sideways below its 50% level. Slow stochastic has entered its oversold zone.


No comments:
Post a Comment