WTI Crude chart
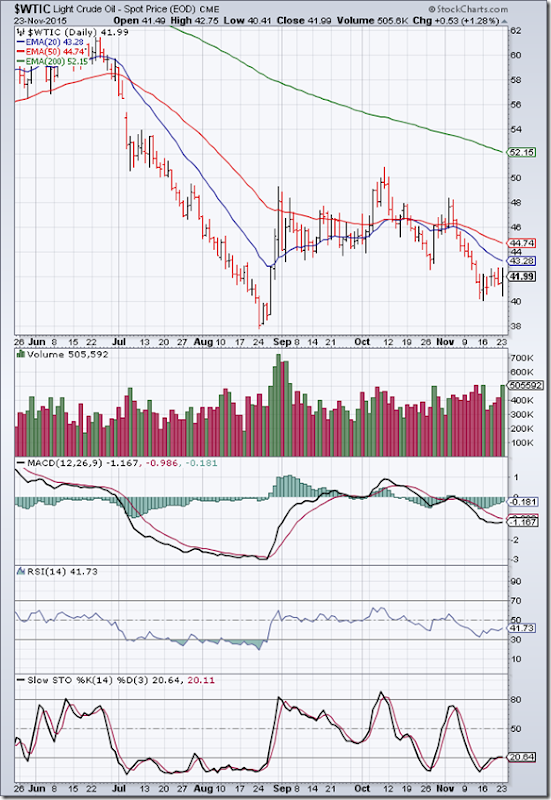
The daily bar chart pattern of WTI Crude oil dropped to a low of 40 on Nov 16, but formed a ‘reversal day’ pattern (lower low, higher close) and bounced up a bit.
However, oil’s price failed to overcome resistance from its falling 20 day EMA, and closed below all three EMAs in a bear market.
Daily technical indicators are in bearish zones, but showing faint signs of upward momentum. Strong volumes on two recent up-days is another bullish sign.
Another attempt at a rally may be in progress – thanks to the continued turmoil in the Middle East. A glut in global supply is likely to play spoil sport.
On longer term weekly chart (not shown), oil’s price is trading well below its three weekly EMAs in a long-term bear market. Weekly technical indicators are in bearish zones.
Brent Crude chart
The daily bar chart pattern of Brent Crude oil touched a low of 43 on Nov 16, but formed a ‘reversal day’ pattern (lower low, higher close) and managed to bounced up a little.
More up-days than down-days last week, accompanied by strong volumes is an indication of bottom fishing.
Oil’s price is yet to cross above its falling 20 day EMA, and is trading below its three EMAs in a bear market. Any rally may be short-lived.
Daily technical indicators are in bearish zones, but showing signs of upward momentum.
On longer term weekly chart (not shown), oil’s price is trading well below its three weekly EMAs in a long-term bear market. Weekly technical indicators are in bearish zones, but not showing upward momentum.


No comments:
Post a Comment