FIIs have turned positive about the Indian market again. Their net buying in equities crossed Rs 2500 Crores during the past week, as per provisional figures. DIIs were net sellers of equity worth Rs 625 Crores.
Merchandise exports during Jun ‘15 slumped for the 7th month in a row, touching $22.29 Billion against $22.34 Billion in May ‘15 and almost 16% lower than in Jun ‘14. Imports also contracted – which is a sign of slower economic activity.
After widespread rains in Jun ‘15, the monsoon has been deficient during Jul ‘15. A few positive surprises aside, Q1 (Jun ‘15) results are continuing to disappoint. That may put a lid on bullish exuberance.
BSE Sensex index chart
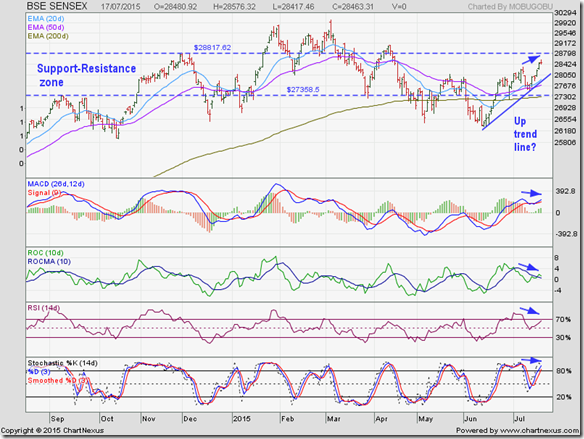
The daily bar chart pattern of Sensex has been in an up trend for the past 5 weeks, which has reversed the down trend from the lifetime high of 30025 touched on Mar 4 ‘15.
All three EMAs have resumed their up moves, and the index has closed well above them at its highest level in 3 months. However, bears are refusing to throw in the towel.
The four technical indicators are in bullish zones, but are showing negative divergences by touching lower tops (marked by blue arrows) while Sensex touched a 3 months high.
Expect a correction towards the blue up trend line. Note that the up trend itself may be under a cloud. Why?
Firstly, the trend line appears a bit too steep. Steep trend lines often get breached easily. Secondly, the up trend may have formed a ‘rising wedge’ pattern, which has bearish implications.
Sensex is rising towards the upper boundary of the ‘support-resistance zone’ between 27350 and 28800. Bears are likely to put up a fight to defend the 28800 level.
The long-term trend remains bullish. Stay invested. Wait for a likely dip to add/buy.
NSE Nifty 50 index chart
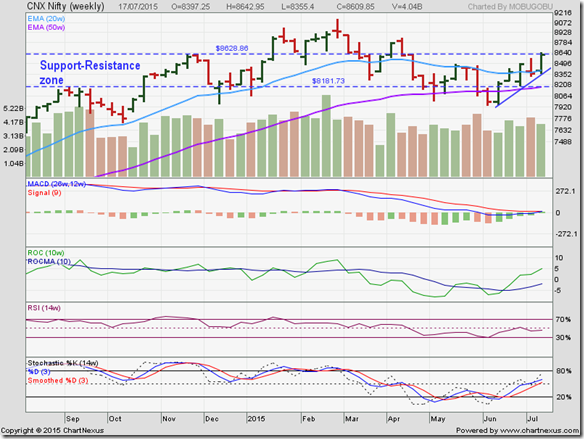
The weekly bar chart pattern of Nifty has extricated itself from a strong 4 months long bear hug, but bulls haven’t quite regained full control.
The index is facing resistance from the upper edge of the ‘support-resistance zone’ between 8180 and 8630. Also, higher volumes during recent down weeks is a sign of active bear presence.
Weekly technical indicators are turning bullish. MACD has entered positive zone and is touching its falling signal line. ROC has moved up to the edge of its overbought zone. Slow stochastic has climbed above its 50% level. RSI is looking a bit bearish by moving sideways below its 50% level.
Nifty is trading above its two weekly EMAs in a bull market. Bears are likely to remain active as long as the index trades below its lifetime Mar ‘15 high of 9119.
Bottomline? The bar chart patterns of Sensex and Nifty have been in 5 weeks long up trends, and look poised to touch new highs in the not-too-distant future. The upward path may not be smooth because of technical potholes and ditches. Long-term trends are bullish, so dips can be used to add.
(Note: Are you looking to add good quality mid-cap and small-cap stocks to your portfolio? Subscribe to my Monthly Investment Newsletter. A limited number of paid subscriptions are being offered till July 21, 2015.)


No comments:
Post a Comment