Gold Chart Pattern
The following remarks were made in the previous post on the daily bar chart pattern of gold: “The bullish pattern of 'higher tops and higher bottoms' from the Mar '15 low still remains in force. But for how much longer? Strong volumes on down days show that bears are regaining control.”
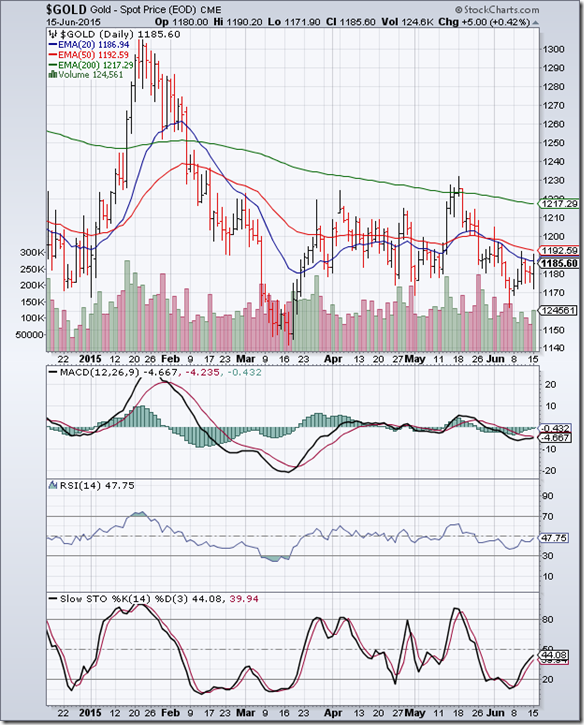
Gold’s price touched an intra-day low of 1162 on Jun 5 ‘15. The subsequent technical bounce faced resistance from its falling 50 day EMA.
By falling below the May ‘15 low of 1170, the bullish pattern of ‘higher tops and higher bottoms’ from the Mar ‘15 low of 1140 has been negated. All three EMAs are moving down, and gold’s price is trading below them in a bear market.
Daily technical indicators are showing some upward momentum, but remain in bearish zones. MACD has moved up to touch its falling signal line in negative zone. RSI is making another attempt to cross above its 50% level. Slow stochastic has climbed up towards its 50% level. Bears are unlikely to give up control anytime soon.
On longer term weekly chart (not shown), all three weekly EMAs are moving down, and gold’s price is trading below them in a long-term bear market. Weekly technical indicators are in bearish zones but not showing much downward momentum.
Silver Chart Pattern
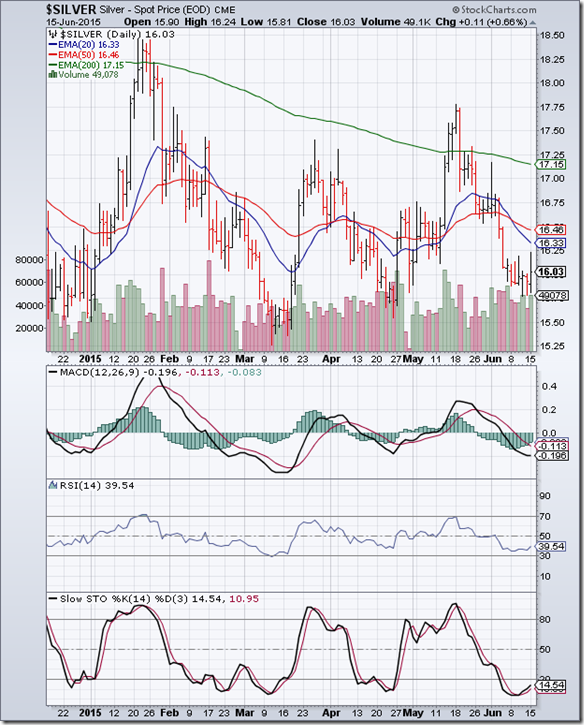
The daily bar chart pattern of silver faced strong selling and dropped sharply below its 20 day and 50 day EMAs into bear territory at the beginning of the month. It has been consolidating in a range between 15.75 and 16.25 since then.
Strong volumes on up days is a sign of accumulation. The bullish pattern of ‘higher tops and higher bottoms’ from the Mar ‘15 low of 15.25 remains in force – but may not be for long. Bears are still ruling the chart.
Daily technical indicators are in bearish zones, but showing a bit of upward momentum. MACD is below its falling signal line in negative territory, but its downward momentum has stalled. RSI is below its 50% level, but trying to move up. Slow stochastic has formed a ‘rounding bottom’ bullish pattern inside its oversold zone.
On longer term weekly chart (not shown), silver’s price is trading below its three weekly EMAs in a long-term bear market. Technical indicators are in bearish zones.


No comments:
Post a Comment