Gold Chart Pattern
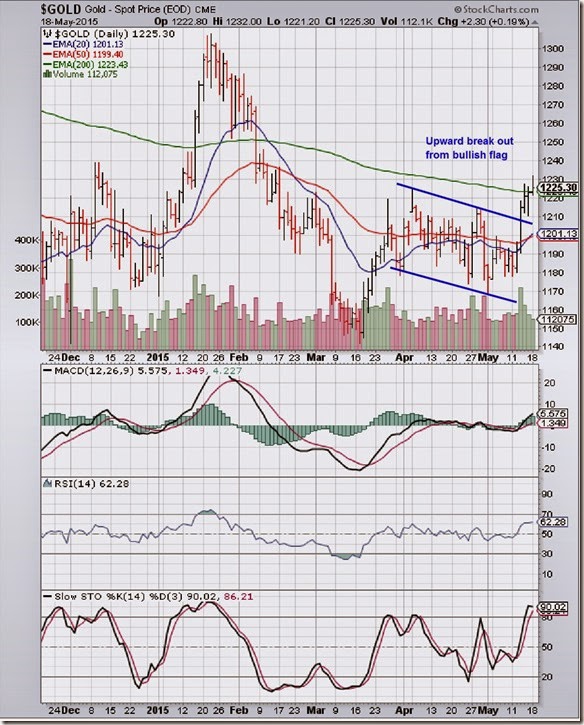
The following comments appeared in the previous post on the daily bar chart pattern of gold: “… gold’s price appears to have formed a bullish ‘flag’ pattern. An earlier upward breakout from an ‘inverse head and shoulders’ pattern ended in failure due to lack of follow-up buying. Any breakout from the ‘flag’ may meet the same fate – unless the breakout is accompanied by strong volumes.”
The upward breakout from the ‘flag’ on May 13 was accompanied by a sharp volume spike that technically validated the breakout. The subsequent rally managed to cross above the falling 200 day EMA into bull territory. But falling volumes during the past three trading sessions mean that the rally may flatter to deceive.
Daily technical indicators are in bullish zones, but their upward momentum is slowing down. MACD has crossed above its signal line to enter positive zone. RSI is moving sideways above its 50% level. Slow stochastic is well inside its overbought zone, but its upward move has stalled.
Some more upside is possible, but expect bears to step in at any time to push down gold’s price below its 200 day EMA. A strong move above 1260 will technically validate the breakout above the 200 day EMA.
On longer term weekly chart (not shown), gold’s price has crossed above its 20 week EMA but is facing resistance from its 50 week EMA. The 200 week EMA is falling, and gold’s price is trading below it in a long-term bear market. Technical indicators are turning bullish.
Silver Chart Pattern
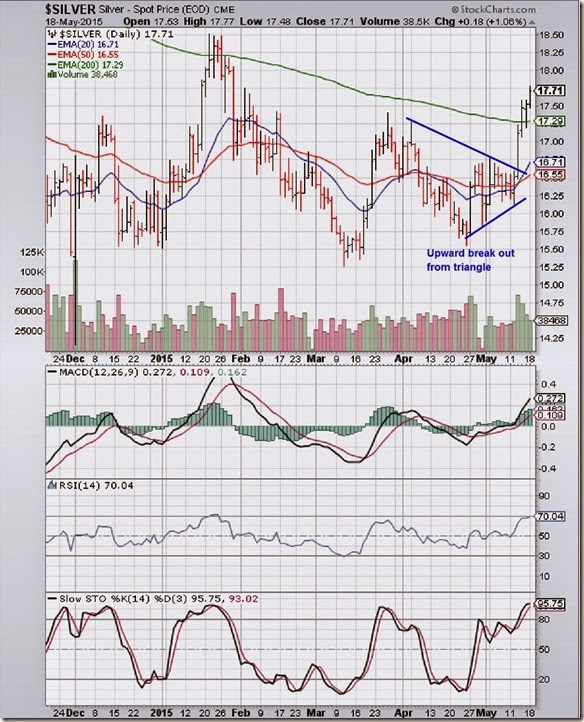
The daily bar chart pattern of silver followed the yellow metal by breaking out upwards from a ‘triangle’ pattern within which it was consolidating for 6 weeks. A strong volume surge accompanied the breakout and was followed by a sharp up move above the falling 200 day EMA.
Is the bear market in silver finally over? Not quite. The breakout above the ‘triangle’ is technically valid. Not so for the breakout above the 200 day EMA. Why? Because silver’s price is still within the 3% ‘whipsaw’ limit above its 200 day EMA.
Daily technical indicators are looking bullish, and overbought. MACD has risen sharply above its signal line, and entered its overbought zone. RSI has reached the edge of its overbought zone. Slow stochastic is well inside its overbought zone.
A correction can occur at any time.
On longer term weekly chart (not shown), silver’s price has just managed to close above its falling 50 week EMA, but is trading well below its 200 week EMA in a long-term bear market. Technical indicators are turning bullish.


No comments:
Post a Comment