Trading activity remained at a low key during a holiday-shortened week. During the second half of Sep ‘14, FIIs turned net sellers and DIIs became net buyers of equity shares. However, for the entire month, FIIs were net buyers of Rs 1500 Crores while DIIs were net sellers of Rs 1100 Crores.
RBI Governor’s announcement about unchanged interest rates was widely expected by market experts. What came as a surprise was a hint that interest rates may not be reduced any time soon, as CPI inflation is more likely to rise towards 8% instead of sliding down to 6%. That means rate sensitive sectors will continue to struggle.
Both Sensex and Nifty closed marginally lower for the week. Trading remained within narrow ranges, but was quite volatile with wide intra-day fluctuations. The market appears to be in wait and watch mode till the next triggers - expected from Q2 results announcements and elections in a few states.
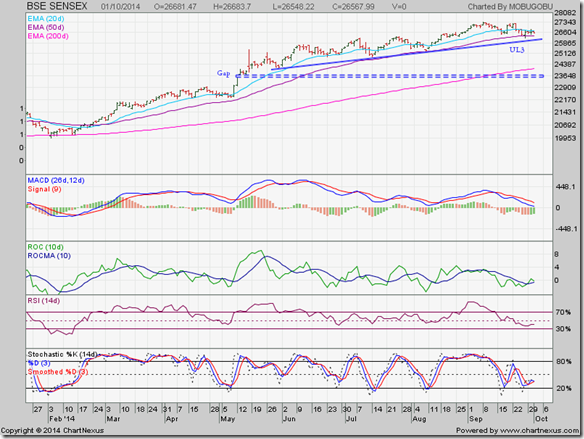
BSE Sensex index chart
In a 3-day trading week, the daily bar chart pattern of Sensex consolidated sideways in between its 20 day and 50 day EMAs, closing about 60 odd points lower. The post-election up trend line (UL3) was not tested – though the possibility of a test of support from the trend line is still on the cards.
Daily technical indicators continue to look bearish – which means some more correction or consolidation is likely. MACD is falling below its signal line and is about to enter negative territory. ROC crossed above its 10 day MA only to drop back into its negative zone. RSI is moving sideways below its 50% level. Slow stochastic is also below its 50% level.
The index is trading above UL3 trend line and well above its rising 200 day EMA. The long-term bull market is under no threat. The correction is providing an adding opportunity – particularly in good stocks that have fallen more than the index.
On longer term weekly chart (not shown), all three weekly EMAs are rising and Sensex is trading above them in a long-term bull market. Weekly technical indicators have corrected overbought conditions, but remain in bullish zones.
NSE Nifty 50 index chart
The weekly bar chart pattern of Nifty traded within a narrow range and closed about 25 points lower for the week. Support from the up trend line - marked UL3 – has held so far. The index is trading above its two up trend lines and its two weekly EMAs in a long-term bull market.
Weekly technical indicators are in bullish zones, but showing a bit of downward momentum. MACD has crossed below its signal line inside its overbought zone. ROC is falling below its 10 week MA in positive territory. RSI is moving sideways above its 50% level. Slow stochastic has slipped down from its overbought zone.
Some more correction or consolidation can be expected, but buying support can emerge at any time.
Bottomline? Chart patterns of BSE Sensex and NSE Nifty indices are in the midst of mild bull market corrections. Don’t panic and sell if the indices correct some more. Avail the opportunity to add good stocks that have fallen more than the indices.


No comments:
Post a Comment