CAC 40 Index Chart (France)
In last week’s analysis of the 6 months daily bar chart pattern of CAC 40, the following comments were made: “Bears are unlikely to release their strong grip on the chart unless the index crosses convincingly above 4375 and its falling 20 day EMA. Bearish technical indicators are suggesting that may be easier said than done.”
Note that the index did manage to cross above the 4375 level and its falling 20 day EMA. But was it a convincing cross? The answer is: No. Why? Two technical reasons. First, the 3% ‘whipsaw’ rule applies for any break out (or break down). In this case, that 3% level (above 4375) is about 4500. The index failed to get anywhere near 4500 (which, incidentally, is another resistance level).
Second, there should be at least 10-14 daily closes above any resistance level for a convincing breach. CAC 40 had only a single day’s close above 4375. The first reason (3% rule) is the preferred one for analysis because it has been time-tested on many thousands of charts.
The index faced resistance from its falling 50 day EMA and dropped down to test support from its 200 day EMA. Will the support hold? Seems unlikely from the bearish daily technical indicators.
MACD has crossed above its signal line, but remains in negative territory. RSI faced resistance from its 50% level and is headed down. Slow stochastic just about crossed above its 50% level into bullish zone, but is already back-tracking.
On longer term weekly chart (not shown), the index is continuing to receive support from its 50 week EMA and is trading above its 50 week and 200 week EMAs in a long-term bull market. However, weekly technical indicators are in bearish zones. The support from the 50 week EMA is in danger of getting breached. Hold with a strict stop-loss at 4275.
DAX Index Chart (Germany)
The following comments appeared in last week’s analysis of the 6 months daily bar chart pattern of DAX: “Bulls are likely to defend the 9600 level strongly, because a drop below it can take the index much lower towards 9000-9250.”
On Mon. Jul 21, the index actually dropped marginally below the 9600 level intra-day, but managed to bounce up and closed at 9612. It then tried to rally past its falling 20 day and 50 day EMAs over the next 3 days, with very little success.
By Fri. Jul 25, bears took control as the index transacted the highest volumes for the week – but much lower than the previous Friday’s volumes. The index once again dropped close to the 9600 level. Bulls did manage to defend the 9600 level for the week, but how much longer will they be able to do so?
All three daily technical indicators are in bearish zones, and moving down. However, they haven’t quite reached their respective oversold zones. That means further down side is likely.
On longer term weekly chart (not shown), the index closed below its 20 week EMA for the first time since the beginning of Apr ‘14, but is trading above its rising 50 week and 200 week EMAs in a long-term bull market. However, weekly technical indicators are falling and look ready to drop into their respective bearish zones. Hold with a strict stop-loss at 9600.
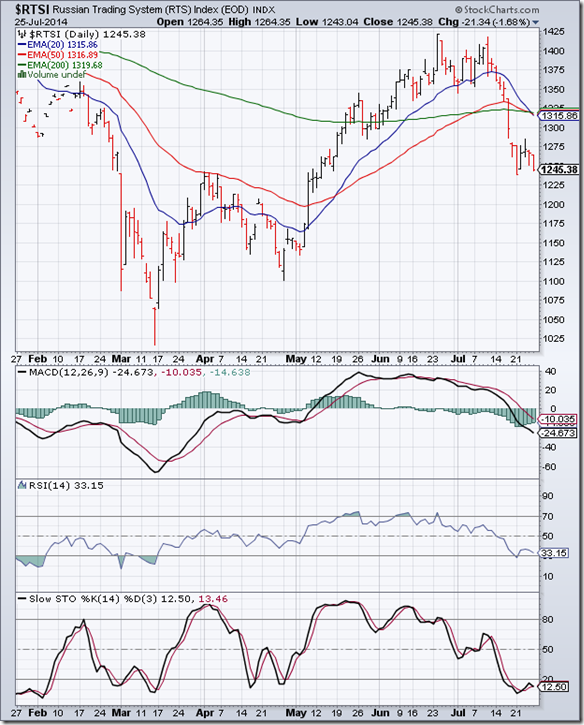
RTS Index Chart (Russia)
Technical indicators were looking a bearish and a bit oversold in last week’s analysis of the 6 months daily bar chart pattern of RTSI. That had led to the following remark: “Any upward bounce from here is likely to face more selling.”
Note that the index dropped and closed below the 1250 level on Mon. Jul 21, but bounced up weakly above the 1275 level on Wed. Jul 23. That was an invitation for bears to resume their selling. By the end of the week, the index closed below the 1250 level once again – losing about 30 points for the week.
All three daily technical indicators are in bearish zones, and moving down. All three EMAs have converged together. A sharp move usually follows. No prizes for guessing in which direction the index is likely to move.
On longer term weekly chart (not shown), the index is trading below its three weekly EMAs in a long-term bear market. Weekly technical indicators are looking bearish. A deeper correction is likely.


No comments:
Post a Comment