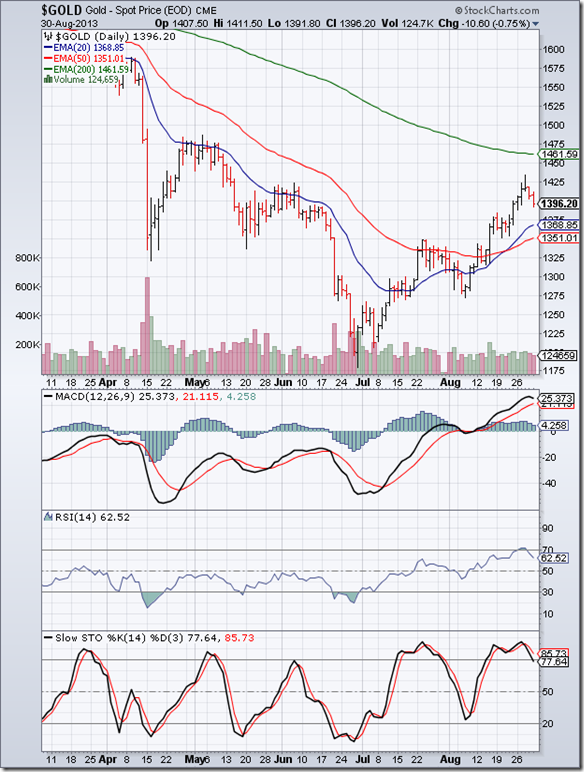
Gold Chart Pattern
The 6 months daily bar chart pattern of gold shows a strong bear market rally for the past 2 months that took gold’s price above its 20 day and 50 day EMAs, and looked all set to test its falling 200 day EMA. But the rally stalled near the 1425 level for two technical reasons: (i) 1425 was the previous top touched in Jun ‘13 - prices tend to hesitate near a previous top; (ii) on long-term weekly chart (not shown), 1425 was the level of the falling 200 week EMA.
The price break out above the bearish ‘falling wedge’ pattern (mentioned in the previous post) was not accompanied by a volume surge, which is a pre-requisite for a valid break out. The ‘false’ break out was followed by a drop back inside the ‘falling wedge’. On the downside, support can be expected from the rising 20 day and 50 day EMAs. Remember that the bear market has not ended, as gold is trading below both its 200 day and 200 week EMAs.
Daily technical indicators are correcting from overbought conditions. MACD has turned down, though it is still above its signal line in positive territory. RSI has dropped down after a brief sojourn in overbought territory. Slow stochastic is about to slip below its overbought zone, after forming a bearish ‘double-top’ reversal pattern.
If gold’s price falls below its 50 day EMA (currently at 1350), it can fall to much lower levels – even below its Jun ‘13 low of1180. The good news for bulls is that mining companies are reportedly shelving expansion plans due to the 2 years long bear phase. Eventually that will cause a supply-demand mismatch causing gold’s price to rise.
Silver Chart Pattern
The 6 months daily bar chart pattern of silver continued its sharp bear market rally that tested its 200 day EMA, but formed a ‘reversal day’ pattern on strong volumes. Note that on Aug 19 also, a ‘reversal day’ pattern was formed, but volumes were not strong enough to reverse the rally. On longer-term weekly chart (not shown), silver’s price failed to reach its falling 200 week EMA.
Daily technical indicators are correcting from overbought conditions. MACD is reversing from its overbought zone. Both RSI and Slow stochastic formed ‘double-top’ reversal patterns inside their overbought zones and have started to fall. Looks like the bear market rally is over and the down move has resumed.
Silver is in a long-term bear market as it is trading below both its 200 day and 200 week EMAs.


No comments:
Post a Comment