S&P 500 Index Chart
The oversold technical indicators in last week’s analysis of the daily bar chart pattern of S&P 500 had hinted at a possible upward bounce towards the 200 day EMA. Bears were expected to sell on such a bounce.
In a Thanksgiving holiday-shortened week, further truncated by reduced trading hours on Friday, bulls staged a surprisingly strong rally that propelled the index past its 200 day and 20 day EMAs. By the end of the week, the index moved up further but halted at its 50 day EMA.
Is the correction over? For the answer, take a look at the last four volume bars on the chart above. Even after discounting the low volumes on Fri. Nov 23 due to early closure of trading, the rally was accompanied by falling volumes – and hence, unlikely to sustain. Looks like the bears may be setting up a bull trap.
Daily technical indicators are turning bullish. MACD has crossed above its signal line, but both are in negative territory. RSI and slow stochastic have risen above their 50% levels. The bulls need to arrange some more follow-up buying – failing which, the bears may overwhelm them.
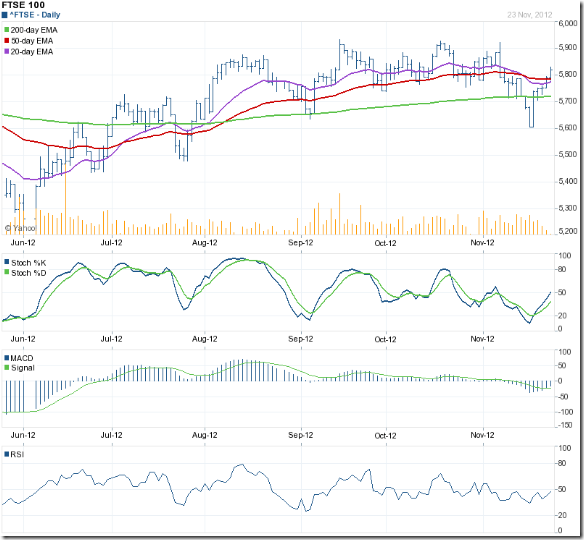
FTSE 100 Index Chart
The 6 months daily bar chart pattern of the FTSE 100 index staged a smart recovery to move above all three EMAs into bull territory. Is it a good time to buy?
Daily technical indicators seem to suggest so. MACD has crossed above its signal line, though both are still negative. RSI is just below its 50% level. Slow stochastic has climbed up to its 50% level. Just the kind of technical set-up that suggests a continuation of the rally.
But trading volumes paint a different picture. Volumes trailed off as the index rose last week, which means the index is moving up on hope and a prayer. It is no surprise that the index is trading below the 5800 level at the time of writing this post.
Bottomline? Daily bar chart patterns of S&P 500 and FTSE 100 indices staged smart rallies but on falling volumes. Bears may have set bull traps. Caution is advised. Any buying should be done with strict stop-losses.


No comments:
Post a Comment