S&P 500 Index Chart
Last week, I had questioned the technical validity of the upward break out in the S&P 500 index chart pattern. The volumes were not significantly higher, and the technical indicators were looking overbought. The conclusion from those two observations were: ‘A pullback to the 50 day EMA … at 1310 is a possibility.’
The index slipped below the 50 day EMA and the 1310 level on Thu. July 14 ‘11 before closing the week at 1316 – a 2% loss on a weekly basis. Note that volumes picked up as the index slid down last week. That should be a concern for the bulls.
The technical indicators have weakened considerably without turning outright bearish. The slow stochastic dropped down from its overbought zone, but remains above the 50% level. The MACD is still positive and above the signal line. The RSI turned around after touching the edge of its overbought zone, and is treading water above the 50% level.
If the index drops below the 50 day EMA – and there is every possibility of its doing so – it could go down to seek support from the still rising 200 day EMA. Technically, the S&P 500 is in a bull market – so dips can be used to buy, but with a strict stop-loss at 1250.
The economy continues to make slow progress. Retail sales have been better than expected, with a 8% YoY increase in sales in June ‘11 – the best in six years. Initial unemployment claims were 405,000 – a decrease of 22,000 from the previous week, but the 14th straight week above the 400,000 level.
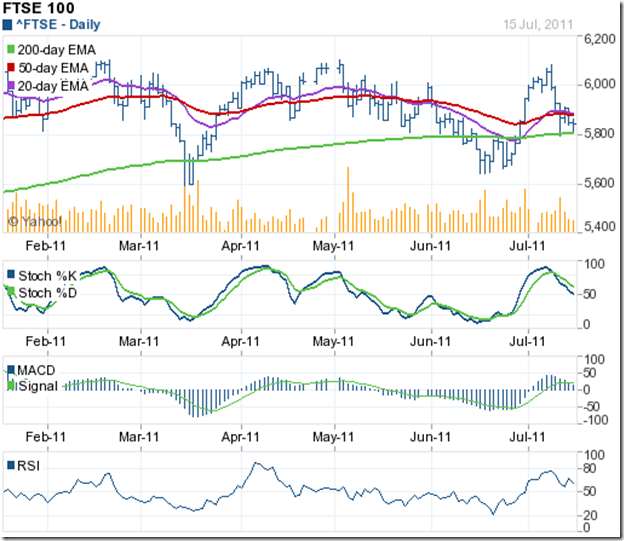
FTSE 100 Index Chart
The ‘reversal day’ pattern on Fri. Jul 8 ‘11 and the overbought conditions of the technical indicators were the reasons why I had mentioned in last week’s analysis that the FTSE 100 index chart may drop to the 50 day EMA or even the 200 day EMA.
The index dropped below the 50 day EMA to the 200 day EMA intra-day on Tue. Jul 12 ‘11 on strong volumes. The subsequent upward bounce took the index above the 50 day EMA for a day. But the bullish fervour petered out on sliding volumes.
The technical indicators are hinting at another move below the 200 day EMA. The slow stochastic has fallen to the 50% level from its overbought zone, and is heading down. The MACD is barely positive, and below its signal line. The RSI slipped down after nearly touching its overbought zone, and is trying to make up its mind whether to drop below the 50% level or not. If you use the dip to buy, maintain a strict stop-loss at 5600.
As per this article, the Eurozone economy has been in muddle-through mode ever since the Greek debt crisis broke. Muddle-through, but not collapse by any means. That should be music to the ears of the bulls.
Bottomline? The chart patterns of S&P 500 and FTSE 100 indices are still in corrective moods and can remain so a bit longer. The dips can be used to buy for short-term trading opportunities. Both indices have been moving sideways for 6 months without a clear trend emerging.


No comments:
Post a Comment