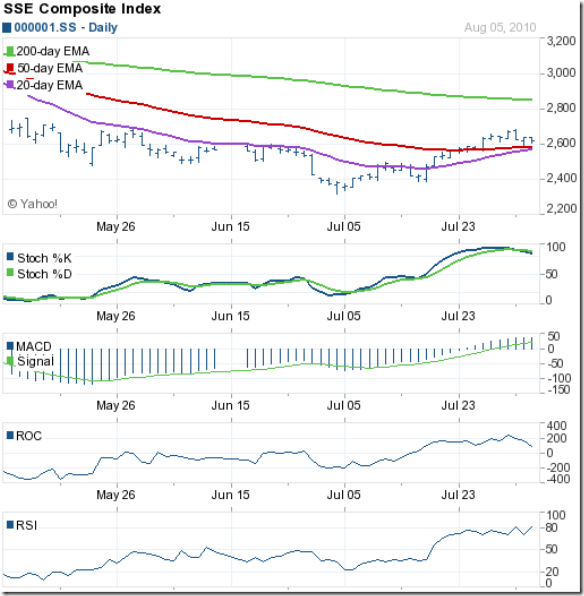
Shanghai Composite index chart
In last week’s analysis of the Shanghai Composite index chart pattern, negative divergences in the ROC and RSI led me to conclude that there could be a pause, if not a correction, in the recent rally.
The index closed the week at 2658 with a small 20 point again, and fluctuated between a high of 2682 and a low of 2590. The 200 day EMA is still falling with the index below it, which means the long-term bear market continues.
The 20 day EMA is about to cross above the 50 day EMA, and the technical indicators remain positive – so the rally may continue a while longer. The slow stochastic is in its overbought zone but slipping a bit. The MACD is above the signal line in positive territory, but has stopped rising. The ROC has started falling after edging above the 200 level. The RSI seems to be hesitating at the edge of its overbought zone.
China’s GDP growth is expected to moderate slightly, and is likely to be around 8% – which will be far higher than the anaemic growth rates in Europe and USA.
Hang Seng index chart
The chart pattern of the Hang Seng index closed the week at 21679, almost a 650 points (3%) gain for the week – and is just about 700 points below the Apr ‘10 top of 22389. Will it be able to breach the previous high?
Declining volumes through the week raise some doubts, though the technical indicators are looking quite bullish. The 20 day EMA has crossed above the 200 day EMA. The 50 day EMA is likely to follow suit, providing the final technical confirmation of a return to the bull market.
The slow stochastic is well inside the overbought zone. The MACD is above the signal line in positive territory. The ROC is positive and taking a breather. The RSI has smartly moved up into the overbought zone.
The RSI typically doesn’t spend much time inside the overbought zone, so a pause in the up move can be expected.
Taiwan (TSEC) Index Chart
The chart pattern of the Taiwan (TSEC) index was struggling below the 200 day EMA after a brief sojourn above it in the third week of Jun ‘10. After touching a low of 7252 on Jul 1 ‘10, the index embarked on a strong month long rally that hit a high of 8019 on Thu. Aug 5 ‘10 before closing the week at 7963.
The Apr ‘10 double top at 8190 is the next target for the bulls, to test and then to cross. Volumes have been rising during the rally, but Thursday’s ‘reversal day’ (higher high and lower close) on the highest volumes since Jan ‘10 is a sign of distribution.
All three EMAs are rising with the index well above them. The slow stochastic has been inside the overbought zone for more than 3 weeks. The MACD is positive and above the signal line. The ROC is positive but dipping. The RSI is just below the overbought zone.
The ROC and RSI have failed to make new highs even as the index has made a higher top. The negative divergences could lead to a pause or a correction in the bull rally.
Bottomline? The chart patterns of the Hang Seng and Taiwan (TSEC) indices are in bull markets, but are yet to move past their Apr ‘10 tops. The Shanghai Composite index chart is still in a bear market. All three are in the midst of bull rallies, which may face some headwinds. Stay invested.


No comments:
Post a Comment