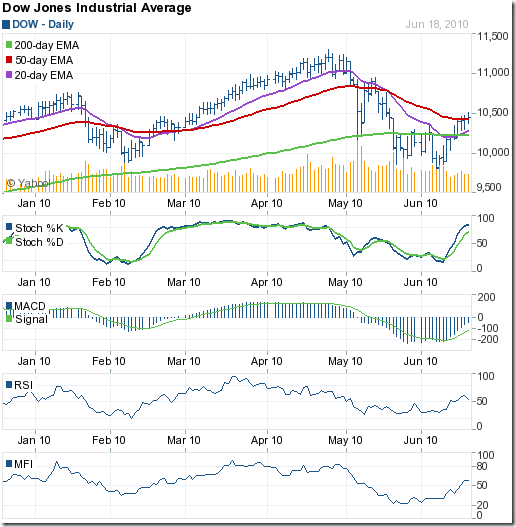
Last week, I had observed a 'reversal week' pattern in the Dow Jones (DJIA) index chart - a lower low and a close higher than the previous week. Positive divergence in the RSI indicator also suggested that the bulls will be able to control the proceedings for some more time.
Some times the index behaves exactly the way you expect - giving technical analysis an aura of predictability that it mostly doesn't deserve. Mr Market just happened to oblige, perhaps to keep people like me motivated!
Seven straight up days for the Dow led to a higher weekly close for the second week in a row. The index comfortably crossed the 200 day EMA and closed exactly on the 50 day EMA, after moving above the medium-term average intra-day.
Have the dark clouds of a double-dip recession been blown away? Was the Euro-zone debt default news just media hype? Are the bulls well and truly back in the saddle after a bear-mauling? A look at the 6 months bar chart pattern of the Dow Jones (DJIA) index may provide some answers:
By correcting less than 20% from the top and moving above the 200 day EMA, the Dow may have negated the possible drop into a bear market. But it isn't time yet to celebrate. Friday's intra-day high of 10514 is a 50% Fibonacci retracement of the correction from the Apr '10 top of 11309 to the Jun '10 low of 9726.
Till the Dow clears the 61.8% retracement level of 10700, doubts about the resumption of the bull rally will remain. The RSI is exhibiting negative divergence, as it dipped down towards the 50% level.
The other technical indicators are favouring the bulls. The 20 day EMA has moved above the 200 day EMA. The slow stochastic is in the overbought zone. The MACD is above the signal line and quickly rising in negative territory. The MFI is above the 50% level.
The fundamental news is a bit mixed. The manufacturing data for May '10 came in ahead of expectations, with both industrial production and capacity utilisation showing improvement over Apr '10. A contradictory picture emerged from the housing data. Home builder sentiment and housing starts dipped more than expected. Unemployment data continues to be a drag on investor sentiment.
Bottomline? The chart pattern of the Dow Jones (DJIA) index is poised at an important technical level. Asian and European indices are continuing their rally. The Dow should follow suit. The final barrier for the bulls will be the previous top of 11309. Till that is breached, buying should be very selective. This is a good time to dump the non-performers in the portfolio.

No comments:
Post a Comment