S&P 500 index chart pattern

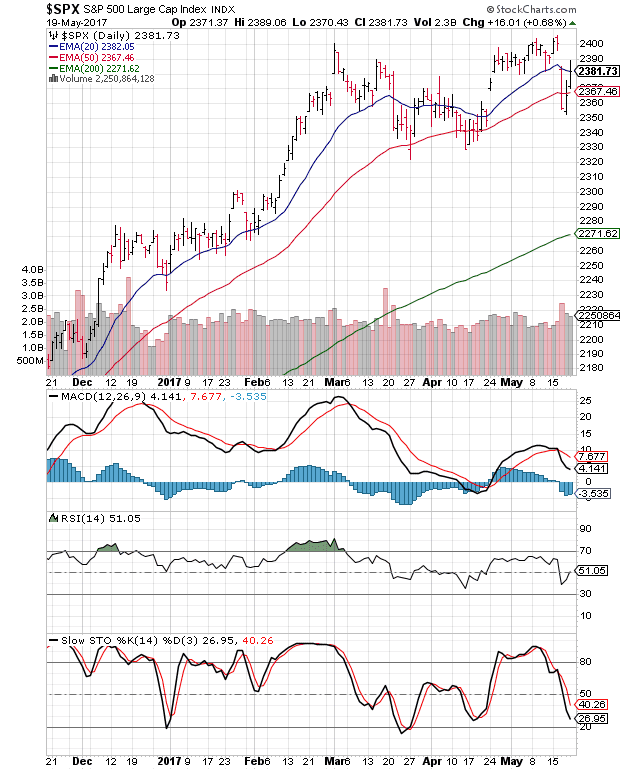
Negative divergences visible on technical indicators had led to the following comment in last week's post on the daily bar chart pattern of S&P 500: "Some more correction or consolidation is likely before a convincing break out above 2400 can occur."
On Mon. May 15, the index closed at 2402 - but it wasn't a convincing close above 2400 because of the '3% whipsaw rule.' The next day, the index touched a new intra-day high of 2405 only to close slightly lower than Monday's closing level - forming a 'reversal day' bar.
That was just the trigger bears needed to jump into action. The index opened trading with a downward 'gap' below its 20 day EMA on Wed. May 17, and fell sharply below its 50 day EMA with huge volumes to close at its lowest level in 4 weeks.
On Thu. May 18, the index dropped a little lower (to 2353) but closed higher - forming another 'reversal day' bar with good volume support - completely filling the upward 'gap' formed on Apr 24. That encouraged bulls to fight back.
The index closed the week above its 50 day EMA but just below its sliding 20 day EMA - partly filling Wednesday's downward 'gap' and losing 9 points for the week.
Daily technical indicators are looking bearish. MACD is falling below its signal line in bullish zone. RSI dropped below its 50% level but has moved up to neutral zone. Slow stochastic is falling below its 50% level towards its oversold zone.
Bears have successfully defended the 2400 level for almost 3 months. However, the next bull charge may overwhelm them. Expect some more consolidation till then.
On longer term weekly chart (not shown), the index formed a weekly 'reversal bar' (higher high, lower close) but closed well above its three rising weekly EMAs in a long-term bull market. Weekly technical indicators are correcting overbought conditions.
FTSE 100 index chart pattern

In last week's post on the daily bar chart pattern of FTSE 100, the following likely index movements were mentioned:
- a test of the Mar 17 top of 7447
- a pullback towards 7400
- a convincing move above 7450 that could put bulls back on the driver's seat
On Mon. May 15, the index easily crossed above 7447 and closed at 7454. The next day, the index soared to a new high of 7534 with strong volume support, and closed at 7522.
On Wed. May 17, the index touched a slightly lower top of 7533 - forming a small 'double top' reversal pattern that brought bears back into action. On Thu. May 18, the index dropped below 7400 to touch an intra-day low of 7389 with strong volumes.
Bulls fought back on Fri. May 19. The index closed the week at 7471 with a 35 points (about 0.5%) gain for the week. (At the time of writing this post, the index has moved up to 7500.)
Daily technical indicators are in bullish zones, but not showing much upward momentum. Some consolidation can be expected before the index touches another new high.
On longer term weekly chart (not shown), the index closed well above its three weekly EMAs in a long-term bull market. Weekly technical indicators are in bullish zones but showing negative divergences by failing to touch new highs with the index.
No comments:
Post a Comment