FIIs were net buyers of equity on Mon., Wed. and Thu. but their net selling on Tue. and Fri. took their net selling for the week to Rs 720 Crores, as per provisional figures.
DIIs were net sellers on Mon. and Wed. but were net buyers on the other three days. Their net buying for the week was more than Rs 1100 Crores.
Sensex and Nifty closed marginally higher for the week, but touched lower tops and ended up near long-term resistance levels.
After diplomatically isolating Pakistan at the recent UN General Assembly meeting, the NDA government is pushing hard to ensure GST implementation from the next fiscal year starting Apr. 2017.
BSE Sensex index chart pattern

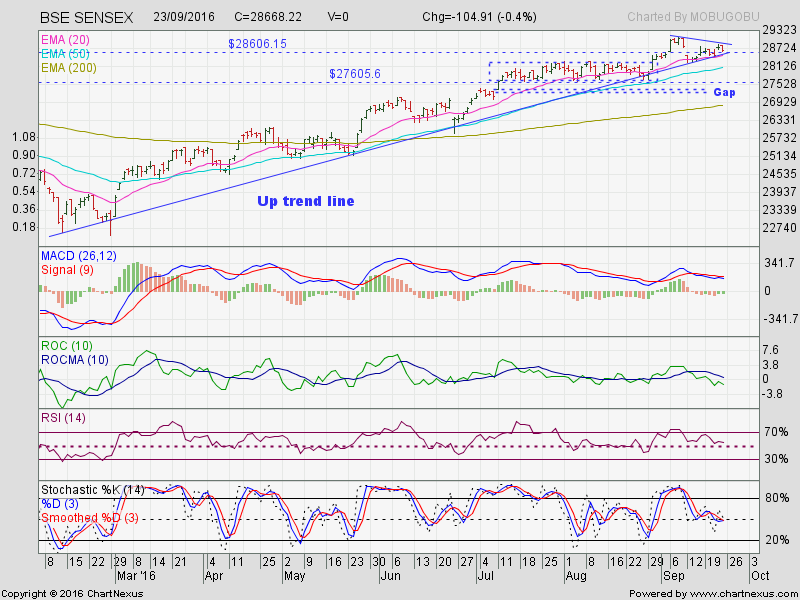
The daily bar chart pattern of Sensex consolidated sideways near the resistance level of 28600 during the first three days of the trading week, before bouncing up on Thu. Sep 22 on the back of FII and DII buying.
The index touched a lower top, formed a 'doji' candlestick pattern (which indicates indecision among bulls and bears) and dropped down to close near the resistance level of 28600 by the end of the week.
The trading during the past three weeks has been confined within a small 'symmetrical triangle' pattern, which is usually a 'continuation' pattern. That means the likely breakout from the 'triangle' is upwards.
The index is trading above its three rising EMAs in a bull market. The blue uptrend line is intact. That lends credence to the upward breakout possibility.
However, triangles are quite unreliable because a breakout can occur in either direction. On odd occasions, the price moves sideways through the apex of the triangle - negating the triangle and turning the horizontal level of the apex (at 28750) into a resistance level.
Daily technical indicators are treading water and giving conflicting signals, which often happens during periods of consolidation. MACD and RSI are in bullish zones. ROC and Slow stochastic are in bearish zones. None are showing any upward or downward momentum.
Bulls and bears are expected to remain cautious ahead of F&O expiry on Thu. Sep 29. Wait for a convincing breakout from the 'symmetrical triangle' before initiating any buy/sell strategies.
NSE Nifty index chart pattern

The weekly bar chart pattern of Nifty closed about 0.5% higher for the week and received good support from the blue uptrend line, but failed to close above the resistance level of 8850 for the second week in a row.
The index is trading well above its two rising weekly EMAs in a bull market. Three of the weekly technical indicators are moving sideways inside their respective overbought zones. Only ROC is looking a bit bearish by sliding down from its overbought zone.
Nifty's TTM P/E remains above its long-term average at 24.24. The breadth indicator NSE TRIN (not shown) has emerged from its overbought zone - hinting at some more correction/consolidation.
Mid-cap and small-cap stocks are continuing to outperform large-cap stocks. This is typical during bull phases. Remember that the opposite holds true during bear phases, when mid-cap and small-cap stocks tend to underperform large-cap stocks.
If you are sitting on decent profits on mid-cap and small-cap stocks, this may be a good time to book partial profits.
Bottomline? Bulls and bears are continuing their fight to dominate Sensex and Nifty charts. Rallies from the Feb '16 lows - as marked by blue uptrend lines - are intact. Bulls may be winning the war, but bears are refusing to concede without a good fight.
DIIs were net sellers on Mon. and Wed. but were net buyers on the other three days. Their net buying for the week was more than Rs 1100 Crores.
Sensex and Nifty closed marginally higher for the week, but touched lower tops and ended up near long-term resistance levels.
After diplomatically isolating Pakistan at the recent UN General Assembly meeting, the NDA government is pushing hard to ensure GST implementation from the next fiscal year starting Apr. 2017.
BSE Sensex index chart pattern
The daily bar chart pattern of Sensex consolidated sideways near the resistance level of 28600 during the first three days of the trading week, before bouncing up on Thu. Sep 22 on the back of FII and DII buying.
The index touched a lower top, formed a 'doji' candlestick pattern (which indicates indecision among bulls and bears) and dropped down to close near the resistance level of 28600 by the end of the week.
The trading during the past three weeks has been confined within a small 'symmetrical triangle' pattern, which is usually a 'continuation' pattern. That means the likely breakout from the 'triangle' is upwards.
The index is trading above its three rising EMAs in a bull market. The blue uptrend line is intact. That lends credence to the upward breakout possibility.
However, triangles are quite unreliable because a breakout can occur in either direction. On odd occasions, the price moves sideways through the apex of the triangle - negating the triangle and turning the horizontal level of the apex (at 28750) into a resistance level.
Daily technical indicators are treading water and giving conflicting signals, which often happens during periods of consolidation. MACD and RSI are in bullish zones. ROC and Slow stochastic are in bearish zones. None are showing any upward or downward momentum.
Bulls and bears are expected to remain cautious ahead of F&O expiry on Thu. Sep 29. Wait for a convincing breakout from the 'symmetrical triangle' before initiating any buy/sell strategies.
NSE Nifty index chart pattern

The weekly bar chart pattern of Nifty closed about 0.5% higher for the week and received good support from the blue uptrend line, but failed to close above the resistance level of 8850 for the second week in a row.
The index is trading well above its two rising weekly EMAs in a bull market. Three of the weekly technical indicators are moving sideways inside their respective overbought zones. Only ROC is looking a bit bearish by sliding down from its overbought zone.
Nifty's TTM P/E remains above its long-term average at 24.24. The breadth indicator NSE TRIN (not shown) has emerged from its overbought zone - hinting at some more correction/consolidation.
Mid-cap and small-cap stocks are continuing to outperform large-cap stocks. This is typical during bull phases. Remember that the opposite holds true during bear phases, when mid-cap and small-cap stocks tend to underperform large-cap stocks.
If you are sitting on decent profits on mid-cap and small-cap stocks, this may be a good time to book partial profits.
Bottomline? Bulls and bears are continuing their fight to dominate Sensex and Nifty charts. Rallies from the Feb '16 lows - as marked by blue uptrend lines - are intact. Bulls may be winning the war, but bears are refusing to concede without a good fight.
No comments:
Post a Comment