The IIP number of 6.4% in Aug ‘15 came as a positive surprise – much higher than 4.1% in Jul ‘15 and the highest since Oct ‘12 – showing clear signs of growth in manufacturing.
Inflation climbed up a bit, but was well under control. CPI inflation was 4.4% in Sep ‘15 against 3.7% in Aug ‘15. WPI inflation was –4.54% in Sep ‘15 against –4.95% in Aug ‘15. Higher food prices were offset by lower fuel prices.
Q2 (Sep ‘15) results from Infosys, TCS, HUL, IndusInd Bank were very good, but belied market expectations. FIIs have turned bulls. As per provisional figures, their net buying in equities has exceeded Rs 700 Crores this week. DIIs were net sellers worth Rs 650 Crores.
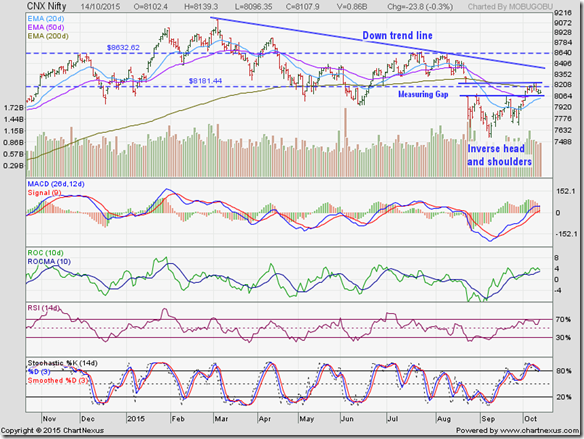
The daily bar chart pattern of Nifty completed an ‘inverse head and shoulders’ reversal pattern and broke out upwards to completely fill the ‘measuring gap’ formed on the chart on Aug 24 ‘15.
The upper edge (8225) of the ‘gap’ acted as a strong resistance level. The index is undergoing a pullback towards the lower edge (8060) of the ‘gap’ – which also happens to be the ‘neckline’ of the ‘inverse head and shoulders’ pattern.
There are three possible moves Nifty can make from here in the near term:
- Continue its correction – as often happens after filling of a downward ‘gap’
- Bounce up after receiving support from the lower edge (8060) of the ‘gap’ and resume its rally
- Consolidate within the ‘gap’ area till Diwali – by which time most of the Q2 (Sep ‘15) results of India Inc. will be announced and digested by the market
So, which option will Nifty choose? Anyone who knows the answer to that question can make some serious money!
Let us try some ‘guesstimates’. Under ‘normal’ circumstances, my vote will go to option 1. But this is not a ‘normal’ circumstance due to the formation of a clearly visible reversal pattern immediately below the ‘gap’.
That increases the possibility of option 2 – or, option 3 followed by option 2. The long-term bull market is intact because Nifty is trading more than 1100 points above its rising 200 week EMA (not shown).
Daily technical indicators are in the process of correcting overbought conditions. MACD is moving sideways above its rising signal line in positive territory. ROC faced resistance from the edge of its overbought zone, and is about to cross below its rising 10 day MA.
RSI is facing resistance from the edge of its overbought zone. Slow stochastic is about to drop down from its overbought zone. Expect Nifty to consolidate or correct a little more.
If you are itching to enter the market, place small bets instead of going ‘all in’. The stock market will be there tomorrow and the day after and the week after and the month after. There will always be opportunities to make money.

No comments:
Post a Comment