S&P 500 Index Chart
The daily bar chart pattern of S&P 500 consolidated sideways during a holiday-shortened week, and closed with a weekly gain of 2%. The index traded below its three EMAs in bear territory for the third straight week, with the falling 20 day EMA providing overhead resistance.
The index maybe forming a ‘symmetrical triangle’ pattern, from which the eventual break out should be downwards. But triangles are unreliable patterns – so it may be prudent to wait for the break out before initiating any buy/sell action.
Daily technical indicators are showing some upward momentum. MACD has crossed above its signal line inside its oversold zone. RSI is moving up towards its 50% level. Slow stochastic has managed to creep up above its 50% level into bullish zone.
Volumes on the lone down-day during the week (Wed. Sep 9) was the highest – indicating strong bear presence.
On longer term weekly chart (not shown), the index closed below its falling 20 week and 50 week EMAs but is trading above its rising 200 week EMA in a long-term bull market. Weekly technical indicators are in bearish zones, but RSI and Slow stochastic bounced up a bit from the edges of their respective oversold zones. The index may drop to the support zone between 1750-1800.
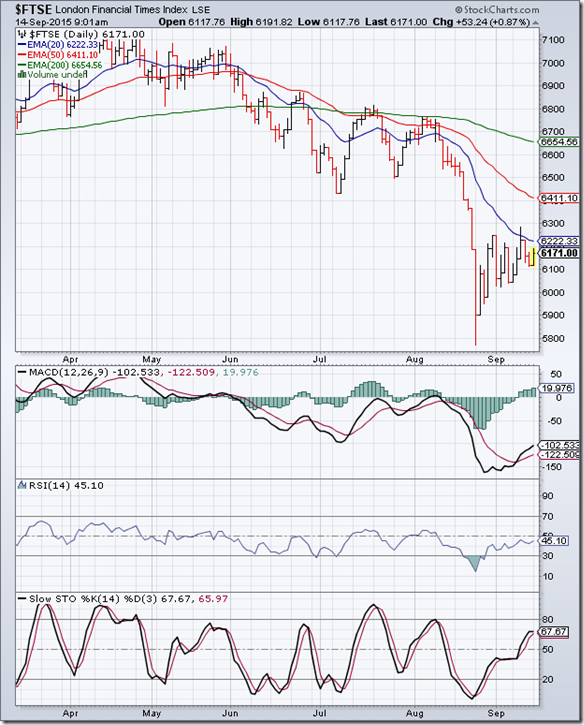
FTSE 100 Index Chart
The daily bar chart pattern of FTSE 100 consolidated sideways with a slight upward bias during the week, gaining nearly 3% on a weekly closing basis. At the time of writing this post, the index is trading with a gain of about 50 points.
The index is trading below its three EMAs in a bear market – as it has done for more than 2 months. The falling 20 day EMA provided good resistance to a couple of attempts by the index to move higher.
Daily technical indicators are giving mixed signals. MACD has crossed above its signal line and is showing upward momentum, but remains inside its oversold zone. RSI is moving sideways below its 50% level. Slow stochastic has moved well above its 50% level, but its upward momentum has stalled.
On longer term weekly chart (not shown), the index closed well below its three weekly EMAs for the fourth straight week, and may have entered a long-term bear market. Weekly technical indicators are in bearish zones.


No comments:
Post a Comment