WTI Crude chart
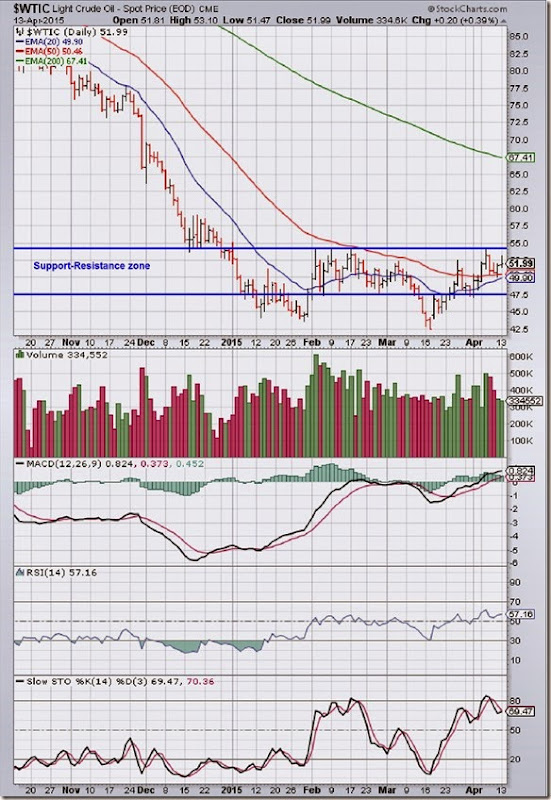
The daily bar chart pattern of WTI Crude oil rallied strongly after touching a 6 years low of 42.50 on Mar 17 ‘15, and re-entered the ‘support-resistance zone’ between 47.50 and 54. (Note that all three technical indicators had shown positive divergences by failing to touch new lows with oils’ price.)
After crossing above the 20 day and 50 day EMAs, oil’s price corrected down to the lower edge of the ‘support-resistance zone’, only to bounce up on strong volumes all the way to the top of the ‘support-resistance zone’. Bear selling stalled the rally.
Oil’s price is trading above its 20 day and 50 day EMAs, but well below its falling 200 day EMA in a bear market.
Daily technical indicators are in bullish zones, and showing some upward momentum. Oil’s price may make another attempt to cross above the 54 level. Expect bears to prevent that from happening.
On longer term weekly chart (not shown), oil’s price continues to trade below its three weekly EMAs in a long-term bear market. Weekly technical indicators have corrected oversold conditions, and are showing some upward momentum.
Brent Crude chart
The daily bar chart pattern of Brent Crude oil had bounced up strongly after receiving good support from the lower edge of the ‘support-resistance zone’ between 52.50 and 64. After crossing above its 20 day and 50 day EMAs, oil’s price stalled near the 60 level on Mar 26 ‘15.
Since then oil’s price has traded sideways within a band between 55 and 60. In spite of a couple of closes above its 50 day EMA, oil’s price is trading well below its 200 day EMA in a bear market.
Daily technical indicators are in bullish zones, but their upward momentum is weak. MACD is above its signal line, and somehow managed to enter positive zone after a month. RSI is moving sideways just above its 50% level. Slow stochastic is above its 50% level but not making much headway.
On longer term weekly chart (not shown), oil’s price is trading below its three weekly EMAs in a long-term bear market. Technical indicators are showing some upward momentum after correcting oversold conditions.


No comments:
Post a Comment