In a holiday-shortened trading week of just 3 days, DIIs were net buyers of equity. FIIs were net buyers on Tue. and Wed. (Mar 31 and Apr 1). Both Sensex and Nifty bounced up from important support zones.
For the month of Mar ‘15, FIIs were net buyers of equity worth Rs 6600 Crores (as per provisional figures). Thanks to a late buying surge, DIIs were also net buyers of equity – but only worth Rs 200 Crores. So, who was responsible for the correction during Mar ‘15? (Hint: read last week’s post.)
HSBC’s Purchase Manager’s Index (PMI) for Mar ‘15 was 52.1 – higher than 51.2 in Feb ‘15, but lower than 52.9 in Jan ‘15. (A reading above 50 indicates economic expansion.) But the average reading for Q4 at 52.06 was lower than the Q3 average of 53.13.
As per the survey, manufacturing growth is improving but capacity constraints and inflation are stifling growth.
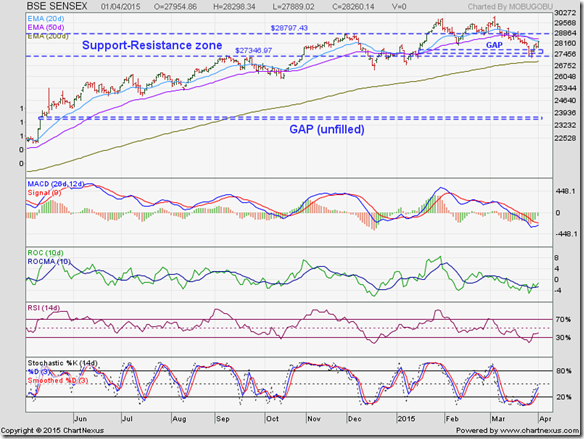
BSE Sensex index chart
The following comment appeared in last week’s analysis of the daily bar chart pattern of Sensex: “Technically, a turnaround seems just around the corner.”
Sensex filled the ‘gap’ near the lower edge of the ‘support-resistance zone’ (between 27350 and 28800) and appears to have resumed its up move. However, the index is facing resistance from its falling 20 day and 50 day EMAs.
A convincing move above 28800 is required break the bear shackles. Will it happen soon?
Daily technical indicators have corrected oversold conditions, but remain in bearish zones. MACD is moving up towards its falling signal line in negative zone. ROC has crossed above its 10 day MA, but is yet to enter positive territory. RSI and Slow stochastic have emerged from their respective oversold zones, but are below their 50% levels.
Bears may put up a fight to defend the 28800 level. Forthcoming Q4 results – not expected to show much improvement over Q3 – will decide their fate.
Note that the 200 day EMA is still rising and the index is trading above it in a long-term bull market. The correction gave a good adding opportunity.
NSE Nifty 50 index chart
The weekly bar chart pattern of Nifty rallied above its 20 week EMA but is facing resistance from the upper edge of the ‘support-resistance zone’ (between 8180 and 8630).
The index has pulled back to the dark blue Up trend line 2 after breaching the trend line in the previous week. Is the pullback a selling opportunity? Bears will say ‘Yes’.
Bulls will point out that the index is in a long-term bull market, and is trading above both its weekly EMAs. Also, the breach below the trend line was not convincing (i.e. the previous week’s close was within the 3% ‘whipsaw’ limit).
Three of the weekly technical indicators are looking bearish. MACD is falling below its signal line in positive zone. ROC is falling below its 10 week MA in negative zone. Slow stochastic is falling below its 50% level. However, RSI is looking bullish by bouncing up from its 50% level.
Some consolidation can be expected at current levels before Nifty resumes its up move.
Bottomline? BSE Sensex and NSE Nifty charts show upward bounces from important support levels, but bulls need to overcome strong overhead resistances. Both indices are in long-term bull markets. The strategy in a bull market should be to ‘buy the dips’, or, if you are holding from much lower levels, just ride out such corrections.


No comments:
Post a Comment