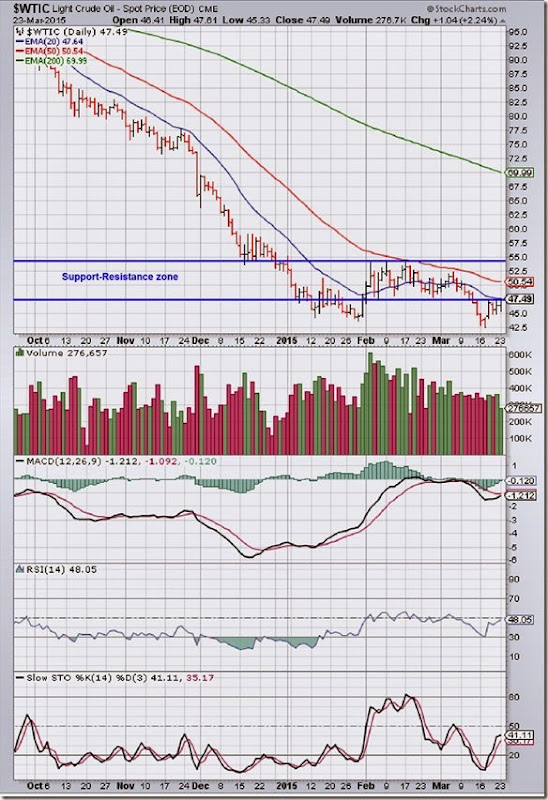
WTI Crude chart
The daily bar chart pattern of WTI Crude oil dropped below the support level of 47.50 and breached its Jan ‘15 low. After touching a 6 yr low of 42.50, oil’s price pulled back to the 47.50 level – where it is also facing resistance from its 20 day EMA.
Bears are likely to use the pullback as a selling opportunity. In case oil’s price manages to re-enter the support-resistance zone (marked by blue horizontal lines) – though the probability seems low – the 50 day EMA should provide strong resistance.
Daily technical indicators are showing some upward momentum, but remain in bearish zones. MACD is below its signal line in negative territory. RSI and Slow stochastic are moving up towards their respective 50% levels.
Saudi Arabia has decided not to cut down its oil production – so, the supply glut in the oil market will continue to put downward pressure on price.
On longer term weekly chart (not shown), oil’s price continues to trade well below its three weekly EMAs in a long-term bear market. Weekly technical indicators are correcting oversold conditions, and showing some signs of upward momentum.
Brent Crude chart
The daily bar chart pattern of Brent Crude oil dropped below the 55 level, but bounced up after receiving support from the 52.50 level. The 20 day EMA is providing resistance. If oil’s price drops below 52.50, it can breach its Jan ‘15 low.
Daily technical indicators are in bearish zones. MACD is sliding below its signal line in negative territory. (Note the bearish ‘rounding top’ pattern formed by the signal line.) RSI is trying to move up towards its 50% level. Slow stochastic has emerged from its oversold zone, but its upward momentum is weak.
On longer term weekly chart (not shown), oil’s price is trading well below its three weekly EMAs in a long-term bear market. Technical indicators have corrected oversold conditions, and showing some upward momentum.


No comments:
Post a Comment