In a holiday-shortened trading week, FIIs were heavy net buyers of equity on Feb 18 & 19 – cancelling out their entire net selling during the month. DIIs continued with their net buying. Yet, both Sensex and Nifty gained only marginally for the week.
The first round of 19 coal block auctions raised nearly Rs 84000 Crores for the government - justifying CAG’s stricture against the previous UPA government’s coal block allocations. The allocations were subsequently cancelled by the Supreme Court.
WPI inflation in Jan ‘15 was –0.39% compared with 5.11% in Jan ‘14. The fall in inflation was primarily due to lower oil prices. Falling inflation and a low IIP number may lead to another rate cut by the RBI after the budget. The stock market will remain open on budget day – following the precedent of three previous budgets on Saturdays.
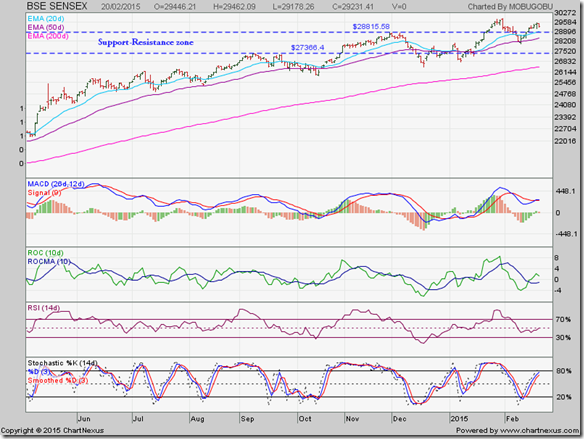
BSE Sensex index chart
The daily bar chart pattern of Sensex crossed the 29500 mark intra-day on Thu. Feb 19 – gaining nearly 1500 points from its Feb 10 low - but closed only 136 points (less than 0.5%) higher for the week, thanks to profit booking on Friday.
All three EMAs are rising, and the index is trading above them in a long-term bull market. The final hurdle towards a new high remains the Jan 30 top of 29844. Will it happen during budget week? FIIs hold the key to that riddle.
Daily technical indicators are looking bullish. MACD has just crossed above its signal line in positive territory. ROC has crossed above its 10 day MA to enter positive territory. RSI has crept above its 50% level. Slow stochastic has risen to the edge of its overbought zone.
A word of caution. Sensex appears to have discounted a ‘good’ budget that will introduce more reforms, cut subsidies and increase infrastructure investments. Disappointment on any of those areas may lead to serious profit booking.
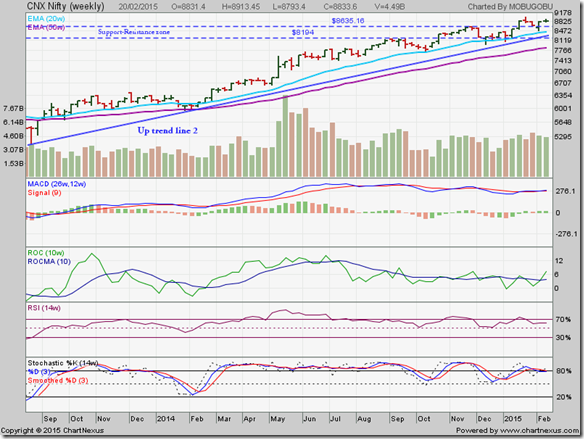
NSE Nifty 50 index chart
The weekly bar chart pattern of Nifty closed just about 30 points higher for the week, but formed a ‘doji’ pattern (in candlestick parlance) that indicates indecision among bulls and bears.
The index is trading above its two weekly EMAs, Up trend line 2 and the support-resistance zone between 8180 and 8630 in a long-term bull market. There is no need to fear a huge correction if the budget proves disappointing for the market.
Weekly technical indicators are looking bullish and a bit overbought. MACD has crossed above its signal line into overbought zone. ROC has moved sharply above its 10 week MA into overbought zone. RSI is moving sideways above its 50% level. Slow stochastic is also moving sideways just below its overbought zone.
Expect an interesting tussle between bulls and bears during budget week – with the scales tipped towards bulls.
Bottomline? Chart patterns of BSE Sensex and NSE Nifty indices are back in bull territories after decent corrections. Corrections in bull markets should be expected and used as opportunities to add. However, near a lifetime high, and the budget event risk, it may be better to adopt a wait and watch mode.


No comments:
Post a Comment