S&P 500 Index Chart
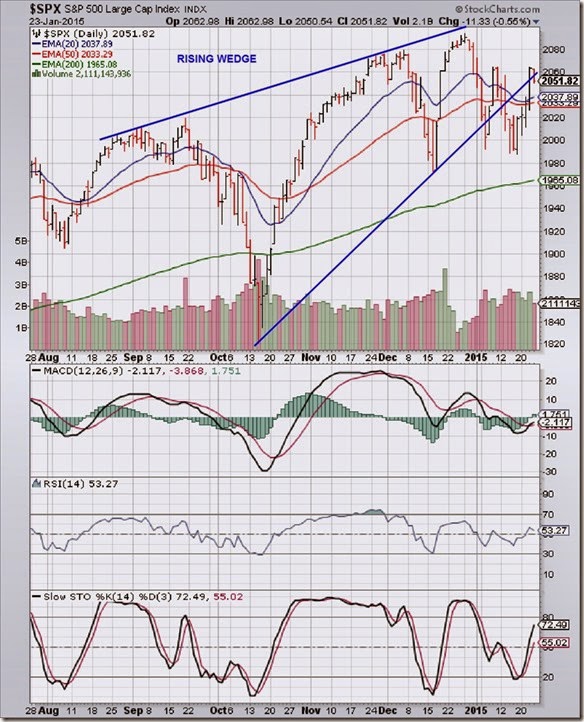
The daily bar chart pattern of S&P 500 shows a ding-dong battle between bulls and bears. A couple of downward breaches of the lower support line of the bearish ‘rising wedge’ pattern have been followed by upward bounces back inside the wedge – one at the beginning of the month and one last week. On both occasions, the index faced strong resistance from the 2064 level and dropped lower.
Both downward breaches were within the 3% ‘whipsaw’ limit – which may explain why the index successfully pulled back within the wedge. Observant readers may note that the index has closed below the wedge once again, but remains above its three EMAs in a long-term bull market. Despite a long bull phase followed by a clearly visible bearish pattern, the index has not reversed trend yet. The wedge may need to be slightly redrawn based on the next few days trading.
The index has been consolidating sideways in a range between 1988 and 2064 during this month. The possibility of such a consolidation was mentioned in last week’s post.
Daily technical indicators are looking bullish – but not overly so. MACD has crossed above its signal line, but is in negative zone. RSI crossed above its 50% level, but has turned down. Slow stochastic is looking the most bullish by rising sharply towards its overbought zone.
On longer term weekly chart (not shown), the index dropped below its 20 week EMA for the third week in a row but closed above it – and is trading above its three weekly EMAs in a long-term bull market. All three weekly technical indicators are in bullish zones but MACD and Slow stochastic are showing downward momentum. Let a clearer picture emerge before taking any buy/sell decision.
FTSE 100 Index Chart
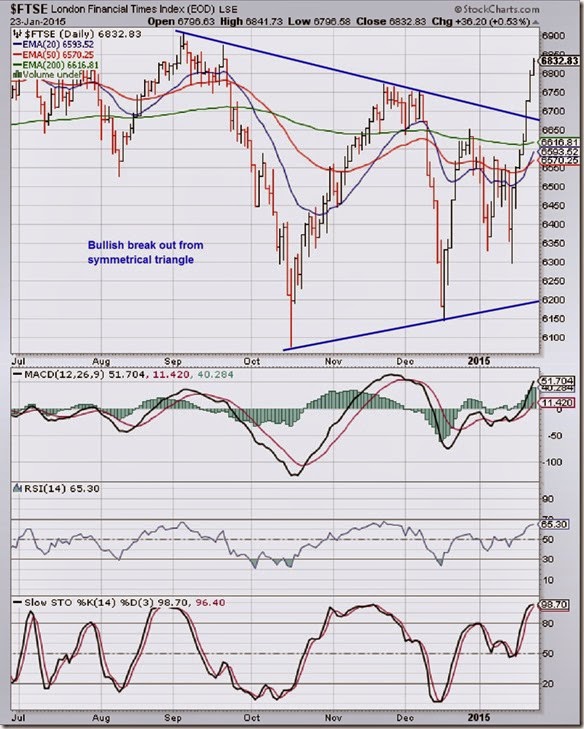
In a surprising bullish move, the daily bar chart pattern of FTSE 100 rallied for 7 straight days to move comfortably move above its three daily EMAs, and broke out above the large ‘symmetrical triangle’ pattern within which it was consolidating since early Sep ‘14.
Daily technical indicators were showing some bullish signs last week. They are now turning overbought. MACD has climbed to the edge of its overbought zone. RSI is just below its overbought zone. Slow stochastic is well inside its overbought zone. The index may pullback towards the triangle – giving a buying opportunity.
The 20 day and 50 day EMAs have started rising up towards the 200 day EMA. Both will need to cross above the long-term moving average for bulls to regain control.
On longer term weekly chart (not shown), the index is trading well above its three weekly EMAs in a long-term bull market. The 20 week EMA is about to cross above the 50 week EMA. Weekly technical indicators are looking bullish. Time to initiate long positions.


No comments:
Post a Comment