There were two surprises for investors last week. The first was an unscheduled 25 bps cut in interest rates by RBI. The second was Swiss central bank’s decision to remove the cap on the value of Swiss Franc against the Euro.
RBI’s rate cut was welcomed by the market. It provided a trigger for FIIs to increase their buying in equity, and caused upward break outs from ‘symmetrical triangle’ consolidations on Sensex and Nifty charts. The Swiss announcement – a prelude to a possible dose of economic stimulus by ECB – led to selling in Europe and US markets.
Q3 results season has started. Private banks have declared a decent set of numbers. TCS results were in line with expectations. But RIL showed a drop in both top and bottom lines. PSU divestments in the pipeline may prevent the market from soaring away.
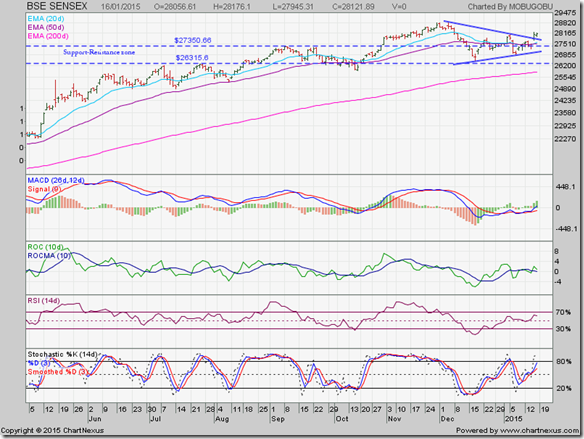
BSE Sensex index chart
In a bull market, upward break outs are to be expected from consolidation zones. RBI’s rate cut announcement on Thursday (Jan 15) led to a break out with an upward ‘gap’ from the ‘symmetrical triangle formed on the daily bar chart pattern of Sensex.
Volumes (not shown) improved during the break out – though not significantly. But when combined with the upward ‘gap’, the break out received technical validity. However, lack of follow-up buying on Friday (Jan 16) is a concern for bulls.
Daily technical indicators are in bullish zones, but not displaying strong upward momentum. MACD has entered positive territory after more than a month. ROC crossed above its 10 day MA to enter positive zone, but has turned down. RSI bounced up after receiving support from its 50% level, but has started to reverse direction. Slow stochastic has climbed to the edge of its overbought zone.
The upward break out from the triangle may turn out to be a ‘false’ one if buying support does not emerge next week. The index needs to convincingly move above its Dec ‘14 twin top at 28800 for bulls to regain full control.
NSE Nifty 50 index chart
The weekly bar chart pattern of Nifty received good support from its 20 week EMA and the support-resistance zone between 7840 and 8180 to close almost 3% higher for the week.
The index had received support from Up trend line 2 in the previous week – thereby increasing the longevity of the up trend. (Remember that a trend becomes stronger the more times a trend line is successfully tested.)
Weekly technical indicators are overcoming their weaknesses. MACD is still below its signal line, but has stopped falling. ROC has bounced up from its ‘0’ line, but is yet to cross above its 10 week MA. RSI and Slow stochastic have moved up to the edges of their respective overbought zones.
Expect the up move to continue. However, the Dec ‘14 top of 8627 is a hurdle that bulls will need to cross convincingly before bears throw in the towel.
Bottomline? Chart patterns of BSE Sensex and NSE Nifty indices have broken out upwards from consolidations within ‘symmetrical triangle’ patterns. Both indices are poised to resume the next legs of their bull rallies. No need to jump in with both feet. For most small investors, a diversified equity fund or a balanced fund may be better options now than trying to pick individual stocks.
(Note: Thinking of adding quality mid-cap and small-cap stocks to your portfolio? Subscribe to my Monthly Investment Newsletter. Paid subscriptions are being offered to blog visitors, followers and subscribers for 3 more days only - till Jan 21, 2015. Contact me at mobugobu@yahoo.com for details.)


1 comment:
Euro fights back against Swiss franc, but QE bets bolstered
http://economictimes.indiatimes.com/markets/forex/euro-fights-back-against-swiss-franc-but-qe-bets-bolstered/articleshow/45910093.cms
Post a Comment