S&P 500 Index Chart
The daily bar chart pattern of S&P 500 touched a new intra-day high of 2046 on Nov 13 ‘14 that tested the upper resistance line of the ‘broadening top’ pattern before retreating a bit to close at a new high just below the 2040 level.
The index gained just 8 points during a week of sideways consolidation. However, failure to cross above the upper resistance line keeps the ‘broadening top’ reversal pattern alive. The following warning was issued last week: “Caution is advised. One needs to respect a reversal pattern till it gets negated.”
Daily technical indicators are showing some signs of correcting down. MACD is well inside its overbought zone, but forming a small ‘rounding top’ reversal pattern. RSI is just below the edge of its overbought zone. Slow stochastic is well inside its overbought zone, but turning down. RSI and Slow stochastic are showing negative divergences by failing to touch new highs with the index.
Though all three EMAs are rising and the index is trading above them in a long-term bull market, a clearly visible reversal pattern at a market top should not be ignored. Booking part profits seems like a very good idea.
On longer term weekly chart (not shown), the index is trading above all three weekly EMAs in a long-term bull market. Weekly technical indicators are in bullish zones but showing negative divergences by failing to touch new highs with the index. The bearish ‘broadening top’ pattern continues to cast a dark shadow over the bull market.
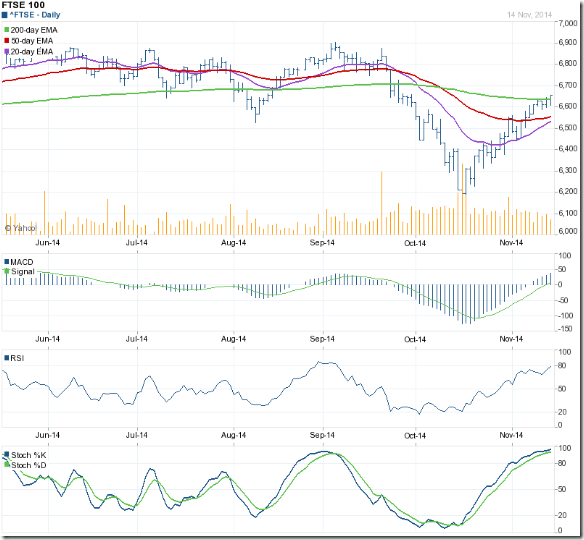
FTSE 100 Index Chart
The daily bar chart pattern of FTSE 100 hesitated near its 200 day EMA for a couple of days before bear resistance was overcome. The index closed above its 200 day EMA and the 6650 level to re-enter bull territory after almost 8 weeks.
But falling volumes have put a question mark on the sustainability of the current rally. The 20 day and 50 day EMAs are rising, but remain below the 200 day EMA. Both need to convincingly cross above the 200 day EMA to technically confirm a return to a bull market.
Daily technical indicators are bullish but looking overbought. MACD is rising above its signal line, and is poised to enter its overbought zone. RSI has reached the edge of its overbought zone. Slow stochastic is well inside its overbought zone. Expect the index to consolidate or even correct a bit before continuing its up move.
On longer term weekly chart (not shown), the index has closed above its 20 week and 50 week EMAs, and more than 400 points above its 200 week EMA. Weekly technical indicators are looking bullish. MACD is about to emerge from its oversold zone. RSI and Slow stochastic have crossed above their respective 50% levels. A strong bear attack that threatened the long-term bull market has been repulsed.


No comments:
Post a Comment