Gold Chart Pattern
The long-term weekly closing chart pattern of gold has been rallying from its Dec ‘13 low, but has failed to overcome resistance from its falling 20 week EMA. Gold is trading below all its three weekly EMAs, and remains in a long-term bear market. Bears are selling on every rise.
Weekly technical indicators are in bearish zones, but showing some upward momentum. MACD has crossed above its signal line in negative territory. RSI has been trying to move above its 50% level since Aug ‘13, but without much success. Slow stochastic is moving up towards its 50% level.
Note that MACD and RSI touched higher bottoms in Dec ‘13 while gold’s price dropped lower. The positive divergences had indicated the likelihood of a rally.
The rally may continue a bit longer. Strong volumes on down weeks indicate that bears are not about to give up their control any time soon.
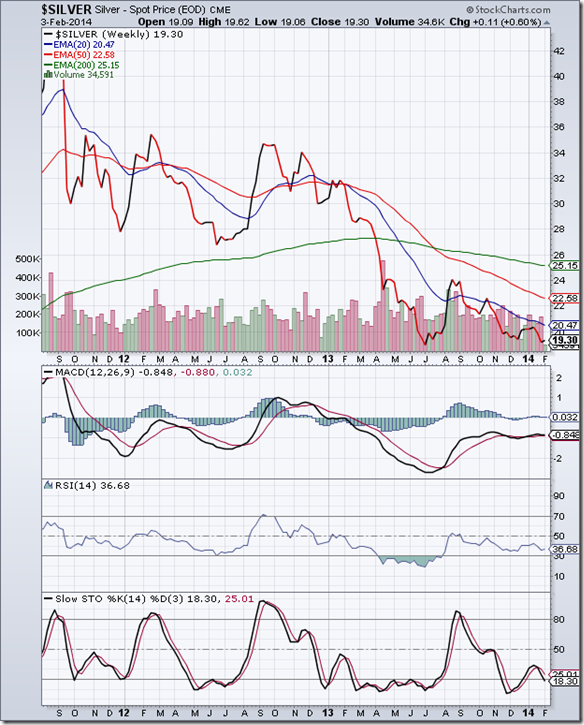
Silver Chart Pattern
The weekly closing chart pattern of silver remains in a down trend in a long-term bear market, touching lower tops and lower bottoms after a sharp rally back in Aug ‘13. All three weekly EMAs are falling and silver’s price is trading below them.
Weekly technical indicators are in bearish zones. MACD is moving sideways - entangled with its signal line in negative zone. RSI is well below its 50% level. Slow stochastic is about to re-enter its oversold zone.
Silver’s price is likely to drop to a new low.


No comments:
Post a Comment