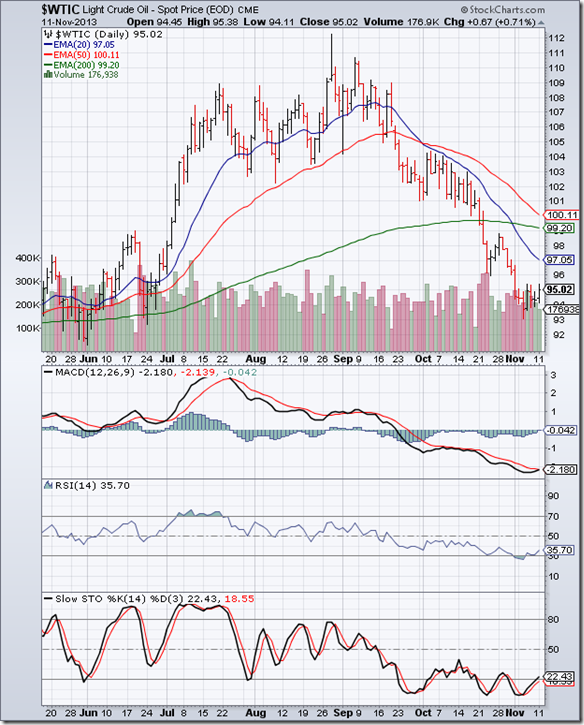
WTI Crude chart
Three weeks back, bearish technical indicators and strong volumes on down days were observed on the daily bar chart pattern of WTI Crude oil. Bears took the opportunity to push oil’s price well below its 200 day EMA.
The 20 day EMA has crossed below the 200 day EMA. The 50 day EMA is about to follow suit. The ‘death cross’ will technically confirm a bear market. Oil is trading below all three EMAs. Volumes continue to be strong on down days. A deeper correction is likely.
Daily technical indicators are correcting oversold conditions, but remain bearish. MACD has moved up a bit to touch its signal line in oversold zone. Both RSI and Slow stochastic are trying to emerge from their respective oversold zones.
A combination of demand slow down and abundant US oil supplies led to a drop in oil’s price. Likely resumption of nuclear talks with Iran may pave the way for rollback of sanctions causing an influx of Iranian oil into world markets – further depressing prices.
Brent Crude chart
The daily bar chart pattern of Brent Crude oil expectedly dropped below its 200 day EMA, and rallied a bit after receiving support at the 107 level before falling sharply on strong volumes to touch a low of 103. The subsequent upward bounce has temporarily delayed the ‘death cross’ of the 50 day EMA below the 200 day EMA.
Daily technical indicators have corrected oversold conditions, but remain bearish. MACD is turning up inside its oversold zone. RSI bounced up from the edge of its oversold zone. Slow stochastic is emerging from its oversold zone.
Bears are likely to use the bounce to sell. Note that oil’s price has formed a bearish pattern of lower tops and lower bottoms for the past 10 weeks.


No comments:
Post a Comment