S&P 500 Index Chart
The 6 months daily bar chart pattern of S&P 500 showed a small loss for the week as it consolidated sideways – getting good support from its rising 50 day EMA. The good news for bulls is that the index managed to close the week above all three EMAs in bull territory.
The bad news is that volumes on three down days were stronger, which is a sign of distribution. Bears are lurking, and may mount another attack at anytime. Daily technical indicators are giving mixed signals with a bearish bias.
MACD is positive, but falling below its signal line. RSI is crisscrossing its 50% level. Slow stochastic is moving sideways below its 50% level. The correction isn’t over yet. However, the index is trading well above its rising 200 day EMA, so the long-term bull market is under no threat.
There are signs that the painfully slow growth of the US economy is about to hit a road block. Initial jobless claims rose marginally, but less than expected. Private job growth was slightly higher. Intermodal rail traffic also rose a bit. But the US Dollar is slipping against global currencies, thanks to the shutdown of the US government and the looming debt ceiling. Only a last-minute resolution of the impasse can save the stock market from tanking.
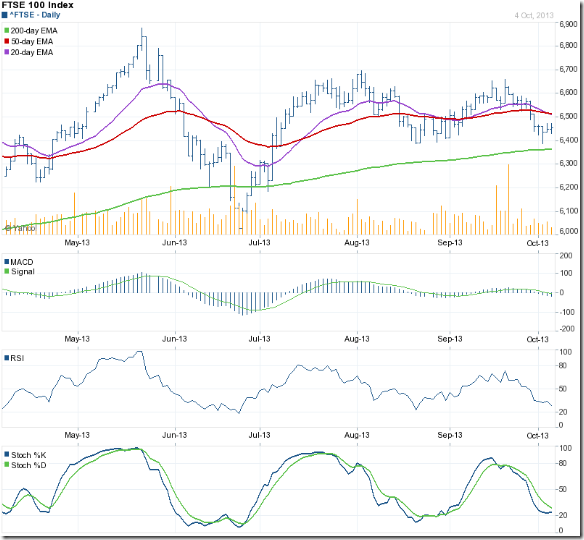
FTSE 100 Index Chart
The 6 months daily bar chart pattern of FTSE 100 index traded sideways between 6400 and 6500 during the week, and managed to close just above the 6450 level. The 20 day EMA is about to cross below the 50 day EMA, showing short-term bearishness. The 200 day EMA is still rising with the index trading above it. The long-term bullishness persists.
Daily technical indicators are looking bearish. MACD has dropped below its signal line into negative territory. RSI and Slow stochastic have fallen below their respective 50% levels, and look ready to enter oversold zones. Some more correction or consolidation is likely.
Bottomline? 6 months daily bar chart patterns of S&P 500 and FTSE 100 indices are still in bear grips, but remain in long-term bull markets. Bull market corrections provide adding opportunities – but be selective and maintain adequate stop-losses.


No comments:
Post a Comment