First, the good news. Infosys declared better-than-expected Q2 results, with quarterly revenue crossing US $2 Billion for the first time. Net profit missed analyst estimates, but that was due to a one-time provision. Revenue outlook is promising. IT stocks and both indices celebrated the results.
Possibility of a resolution to the US fiscal impasse is also good news. Now, the bad news. The August IIP number dropped to 0.6% from 2.75% recorded in July – mainly due to contraction in mining and manufacturing sectors. This is far lower than the consensus estimate of 2.0%. Devastation caused by cyclone ‘Phailin’ is another concern.
Sensex and Nifty are back in bull markets after brief forays into bear territories. Both indices are trading above their long-term moving averages, and look poised to touch new 52 week highs. Curb your impulse to jump in feet first. Biding your time to buy during dips will yield better results.
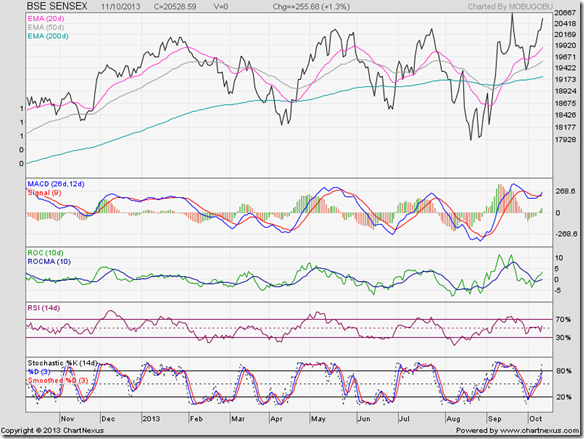
BSE Sensex index chart
The daily closing chart pattern of BSE Sensex closed above the 20500 level for the week, and is just 120 points short of touching a new 52 week high. All three EMAs are rising, and the index is trading above them. Bulls are back on top.
Daily technical indicators are looking bullish. MACD has crossed above its signal line, and looks ready to re-enter its overbought zone. ROC has crossed above its 10 day MA into positive territory. RSI has moved above its 50% level. Slow stochastic has reached the edge of its overbought zone.
Caution near a previous top is advised.
NSE Nifty 50 index chart
After closing below the long-term up-trend line two weeks in a row during Aug ‘13, the weekly closing chart of NSE Nifty is once again back in bull territory. It is trading above its two weekly EMAs and the blue up-trend line. A new 52 week high is barely 90 points away.
Weekly technical indicators are looking bullish. MACD has crossed above its signal line into positive territory. ROC has bounced up sharply off its 10 week MA into positive territory. RSI is rising above its 50% level. Slow stochastic is at the edge of its overbought zone.
Note that volume peaks have been moving down while the index has been moving up from its Aug ‘13 low. A bull market needs volume support to sustain. Proximity to a previous top calls for some caution.
Bottomline? Chart patterns of BSE Sensex and NSE Nifty indices are bullish and ready to touch new 52 week highs. The Rupee continues to strengthen against the US Dollar. The trade deficit has reduced. FIIs have turned net buyers. Looks like ‘game over’ for the bears. However, caution is advised since both indices are close to their previous tops.


No comments:
Post a Comment