The start of results season brought with it the usual share of ups and downs. Infosys, TCS, Bajaj Auto declared better than expected results. RIL results were so-so – its net profit boosted by ‘other income’. HDFC results were a bit below expectations.
Following the share buyback by parent Unilever, HUL’s weightage was increased in a couple of global indices. HUL’s share price spurted a whopping 10% in a single day. Other FMCG stocks joined the bull party. Removal of Raymond and Indian Hotels from F&O list had a negative effect on their respective share prices.
RBI raised short-term rates in a bid to squeeze liquidity to prop up the falling Rupee. Bank stocks took a hit. India’s forex reserves rose marginally after a big drop in the previous week. Despite the economic gloom and doom, the bull market keeps chugging along nicely, as can be seen from the weekly chart of BSE Sensex below.
BSE Sensex index chart
The weekly bar chart of Sensex closed higher for the fourth straight week, and seems ready to climb past its May ‘13 top. Both weekly EMAs are rising and the index is trading above them. The blue uptrend line joining the Jun ‘12 and Apr ‘13 lows, which was briefly breached the trend line intra-week in Jun ‘13, continues to rule the chart.
Three of the four weekly indicators are looking bullish. MACD has crossed above its signal line in positive zone. RSI and Slow stochastic have moved up to the edge of their respective overbought zones. But ROC is showing negative divergence by falling below its 10 week MA. Since the negative divergence has not been supported by the other three indicators, any correction is likely to be of short duration.
NSE Nifty 50 index chart
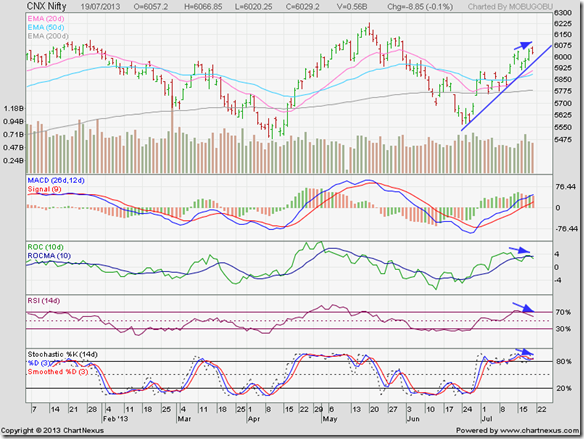
Daily bar chart pattern of Nifty is back in bull territory. The 20 day EMA has crossed above the 50 day EMA and all three EMAs are moving up. The sharp rally from the Jun ‘13 low has completed 4 weeks. But there are a few dark clouds on the horizon.
The blue uptrend line from the Jun ‘13 low is a bit too steep. Such steep up trends don’t sustain for long. Volumes tapered down on the last 2 days of the week. Nifty formed a ‘reversal day’ pattern (higher high, lower close) on Friday. All these point to a temporary halt to the rally.
Daily technical indicators are bullish, but showing some signs of weakness. MACD is rising above its signal line in positive territory. ROC is also positive, but has crossed below its 10 day MA. RSI is sliding down from its overbought zone. Slow stochastic is inside its overbought zone. Three of the four indicators – ROC, RSI, Slow stochastic – are showing negative divergences by failing to touch new highs with the index (marked by blue arrows).
Remember that Nifty is in a bull market, so any dip can be used to add to existing portfolios.
Bottomline? Chart patterns of BSE Sensex and NSE Nifty 50 indices are on their way to touch new highs, but are facing temporary technical headwinds. Any correction/consolidation can be used as an adding opportunity – needless to say, with appropriate stop-loss. Both indices are near their all-time highs; some caution should be exercised.
(PS: If you are planning to add growth-oriented and fundamentally strong mid-cap/small-cap stocks to your portfolio, but are not sure which stocks to choose, book your paid subscription to my Monthly Investment Newsletter now. New subscriptions will be offered till July 21, ‘13.)


No comments:
Post a Comment