S&P 500 Index Chart
For a different and longer-term perspective, let us take a look at the 2 years weekly bar chart pattern of S&P 500 index. It is apparent that a long-term bull market is playing out. All three weekly EMAs are rising and the index is trading above them.
Last week, the index touched another new high of 1530, before closing a bit lower on a weekly basis. By doing so, it formed a ‘reversal week’ bar pattern (higher high, lower close). Such a pattern may end the current leg of the up move. Falling weekly volumes point to such a likelihood.
Weekly technical indicators are bullish, but showing some signs of weakness. MACD is above its signal line in positive territory, but its upward momentum is slowing. RSI is just below its overbought zone, and slipping down. Slow stochastic is well inside its overbought zone, but turning down.
Note that MACD and RSI are showing negative divergences by failing to touch new highs with the index. Some consolidation or correction may be on the cards.
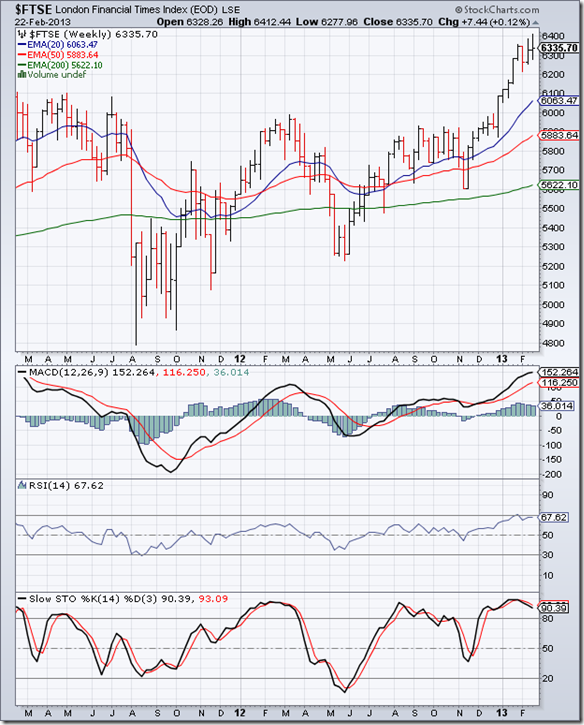
FTSE 100 Index Chart
The 2 years weekly bar chart pattern of the FTSE 100 index is a clear example of the disconnect between the economy and the stock market. The UK economy’s growth is taking two steps forward and then one step back. No such hesitation with the FTSE index, which touched another new high of 6400 during the week.
Weekly technical indicators are bullish, but exhibiting some hint of weakness. MACD is above its signal line in positive territory, but its upward momentum is slowing. RSI is just below its overbought zone. Slow stochastic is inside its overbought zone, but falling.
Note that RSI and slow stochastic failed to touch new highs with the index. The negative divergences may be heralding some correction or consolidation.
Bottomline? The weekly bar chart patterns of S&P 500 and FTSE 100 are touching new highs every week on a flood of liquidity. However, there are signs of a possible correction or consolidation. Stay invested with trailing stop-losses.


No comments:
Post a Comment