WTI Crude chart
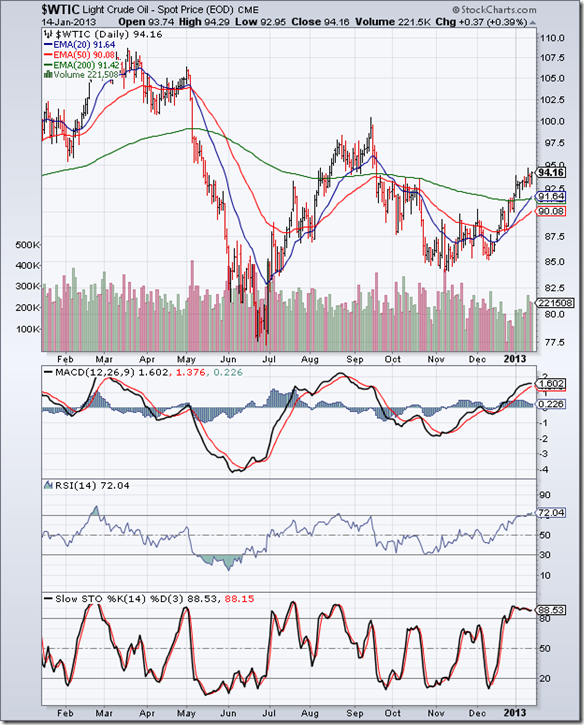
The 1 year daily bar chart pattern of WTI Crude oil is showing a mix of good and bad news from the perspective of bulls. First the good news: After recovering from a higher bottom (touched in Nov ‘12), oil’s price has rallied nicely to cross all three EMAs into bull territory. The 20 day EMA has managed to cross above the 200 day EMA. The 50 day EMA is rising, but is below the 200 day EMA. These are all bullish signs.
Now the bad news: The cross above the 200 day EMA in end-Dec ‘12 was not accompanied by a significant increase in volumes. That could lead to a pullback towards, and even a drop below, the 200 day EMA. Note what happened back in Sep ‘12, when a move above the 200 day EMA was not followed by the ‘golden cross’ of the 50 day EMA above the 200 day EMA.
The up move in Jan ‘13 appears to be losing momentum. MACD is positive and rising above its signal line, but the histogram is falling. RSI has entered its overbought zone, where it doesn’t stay for long. Slow stochastic is inside its overbought zone, but showing negative divergence by sliding down while oil’s price is moving higher.
Though oil’s price is currently trading above its 200 day EMA, the long-term moving average has been gradually falling since touching a peak back in May ‘12. The bearish view will change only if oil’s price can rally past the 100 mark.
On longer-term weekly chart (not shown), WTI Crude oil price is trading above its 200 week EMA, after falling below for two weeks in early Dec ‘12.
Brent Crude chart
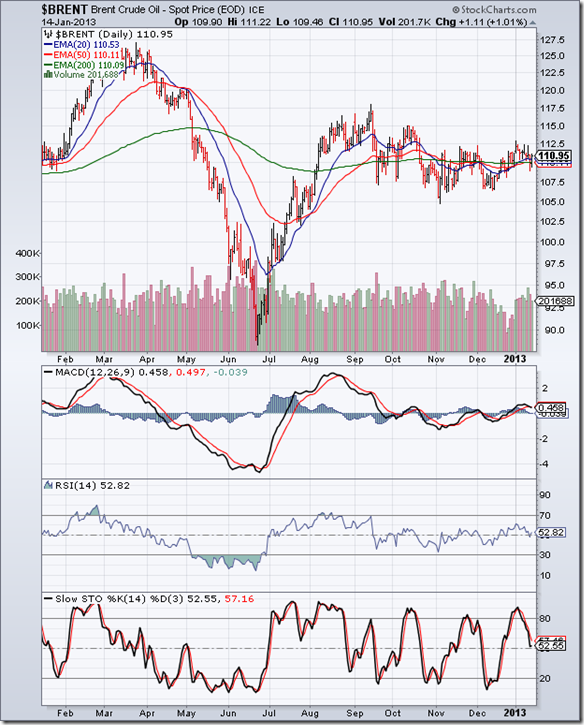
The 1 year daily bar chart pattern of Brent Crude oil has been alternately moving above and falling below its 200 day EMA since Sep ‘12. The 200 day EMA has become flat at the 110 level.
During such sideways consolidation moves, technical analysis becomes a challenge. Note that a higher bottom was touched in Dec ‘12, but slow stochastic showed negative divergence by touching a lower bottom.
No clear direction is visible from RSI and slow stochastic, which are at their 50% levels. MACD is barely positive and dropped to touch its signal line. On longer-term weekly chart (not shown), Brent Crude oil price is trading above its rising 200 week EMA. The long-term bull market is intact.


No comments:
Post a Comment