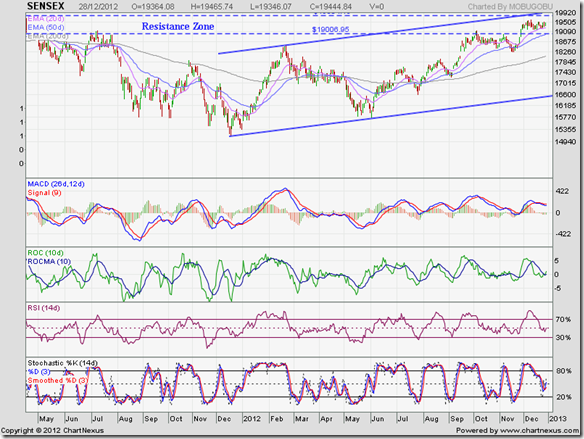
BSE Sensex index chart
Ho hum! Another trading week – this one shortened by the Christmas holiday – was spent inside the long-term resistance zone between 19000 and 19800 by the daily bar chart pattern of Sensex. Expectedly so, but unexciting nevertheless.
The good news is that the 20 day EMA provided good support on the downside. The bad news is likely overhead resistance from the 19800 level and the upper edge of the upward-sloping channel within which the index has been trading for the past year.
All three EMAs are rising and the index is trading above them – the technical sign of a bull market in progress. So, what is the index going to do next?
Daily technical indicators are not giving a clear hint. MACD is in positive zone (bullish), but has slipped below its falling signal line and is showing negative divergence by touching a lower top (bearish). ROC has crossed above its 10 day MA into positive territory (bullish), but is also showing negative divergence by touching a slightly lower top (bearish). RSI is at its 50% level (neutral) and has touched a higher top with the index (bullish). Slow stochastic has crept up above its 50% level (mildly bullish), but is showing negative divergence by touching a slightly lower top (bearish).
Conflicting technical signals are typical during periods of consolidation. The index seems to be treading water – awaiting some trigger to move up or down. Not much has changed in the economy. May be Q3 results in Jan 2013 will provide the trigger. Till then, expect the consolidation to continue.
NSE Nifty 50 index chart
The weekly bar chart pattern of Nifty 50 is stuck in a groove for the past 4 weeks – between 5750 and 5950. The 20 week and 50 week EMAs are moving up and the index is trading above them. The bulls (read FIIs) are gradually gaining ground. The bears (read DIIs) are putting up a good fight.
Last week’s volumes were a little muted – because of a holiday-shortened week, and also because trading activity tends to trail off during the holiday season.
Weekly technical indicators are looking bullish. MACD is above its signal line, and both are moving up in positive territory. ROC is also positive, and about to cross above its 10 week MA. RSI is alternately moving in and out of its overbought zone. Slow stochastic has remained inside its overbought zone for the past 5 months.
Is it possible that Nifty will move up towards the top of the upward-sloping channel and then fall all the way down to the lower end of the channel – as it had done in Feb ‘12 and Jun ‘12? The possibility can’t be ruled out. If it does, it will be a great opportunity to buy large-cap shares.
Bottomline? Chart patterns of BSE Sensex and NSE Nifty 50 indices are consolidating within long-term resistance zones – apparently waiting for some trigger to move up or down. The consolidations may continue for some more time. Keep accumulating fundamentally strong stocks trading at reasonable valuations. (If you don’t know how to pick such stocks from the thousands that trade every day, sign up for my paid Monthly Investment newsletter. New subscriptions will open from Jan 1, 2013.)


No comments:
Post a Comment