Gold Chart Pattern
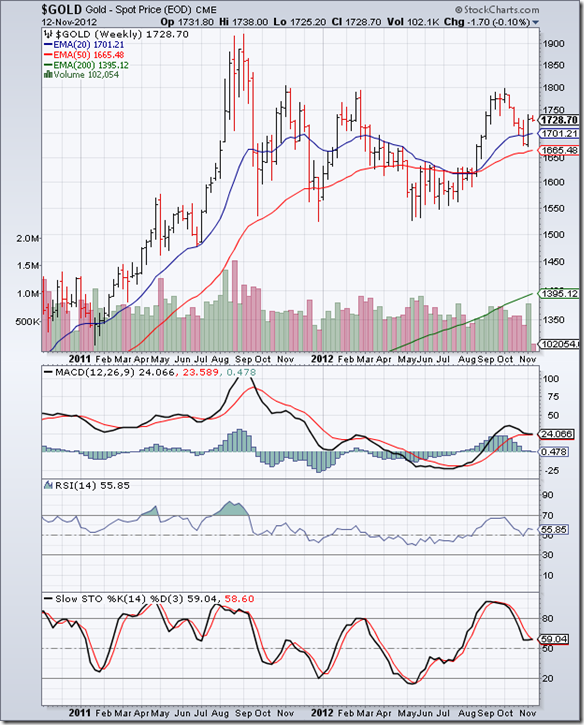
Chart patterns don’t always play out as expected. But once an identifiable pattern starts forming, it is better to await the completion of the pattern (or its negation) before taking a buy/sell decision. In the previous post on gold’s 2 years weekly bar chart, the following points were mentioned:
- The ‘handle’ of a bullish ‘cup and handle’ pattern was still being formed
- A drop below the 50 week EMA would be bearish and negate the ‘cup and handle’ pattern
- Investors were advised to ‘hold, with a strict stop-loss at 1660’.
The ‘cup and handle’ pattern formed as per expectations. Note that gold’s price dropped below the 20 week EMA, but stopped short of the 50 week EMA and the 1660 level. The subsequent jump above the 20 week EMA last week was on significantly strong volumes – indicating that gold’s price is unlikely to drop below the 20 week EMA any time soon, and technically confirming the ‘handle’ formation.
Weekly technical indicators are looking bullish. MACD is moving sideways in positive territory, after merging with its signal line. RSI bounced up from its 50% level. Slow stochastic is also moving sideways above its 50% level.
If you failed to enter during last week’s upward bounce, no need to fret. Enter now with a stop-loss at 1700. Add more when gold’s price crosses 1800 (the rim of the ‘cup’). Upward target on a break out above 1800 is 2080.
Silver Chart Pattern
The formation of the ‘handle’ of a bullish ‘cup and handle’ pattern has been completed on silver’s 2 years weekly bar chart. Silver’s price dropped below its 20 week and 50 week EMAs two weeks back and closed almost exactly at the stop-loss level of 31.
Last week’s upward bounce above its two weekly EMAs was accompanied by strong volumes. That means silver’s price is unlikely to fall below its 50 week EMA in a hurry. Weekly technical indicators are looking bullish. MACD has merged with its signal line in positive zone. RSI has bounced up from its 50% level. Slow stochastic is moving sideways above its 50% level.
One can enter with a stop-loss at 31.50. Add more on a convincing move above 36 (the rim of the ‘cup’). Upward target on a break out above 36 is 46.


No comments:
Post a Comment