Gold Chart Pattern
In an update two weeks ago about gold’s price chart pattern, the following remarks were made: “On the longer-term weekly gold chart (not shown), the 20 week EMA had merged with the 50 week EMA for the past month, and now both EMAs have started moving up with gold’s price trading above them. These are bullish signs.”
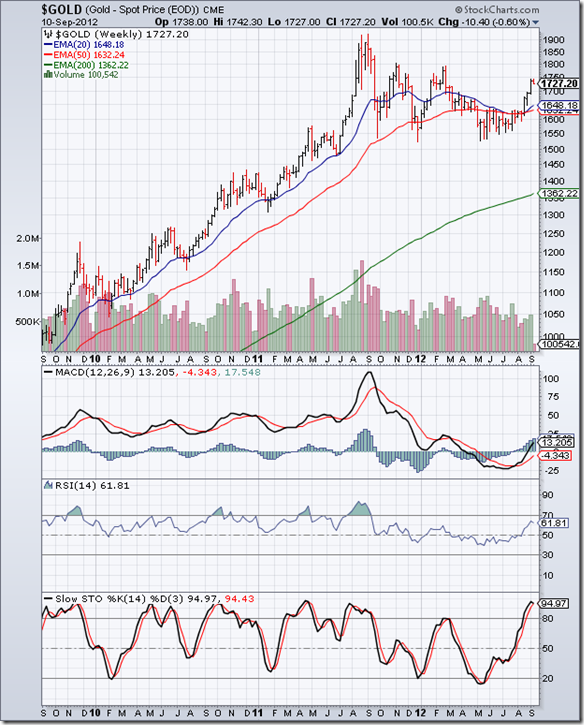
In the 3 years weekly bar chart pattern above, note that the 20 week EMA had remained merged with the 50 week EMA for almost 3 months before finally moving up. The 50 week EMA, which had remained flat since Mar ‘12, is also moving up. Both EMAs are trading well above the rising 200 week EMA. Gold’s price break out above the resistance from its 20 week and 50 week EMAs was accompanied by rising volumes.
Most importantly, the large descending triangle bearish pattern, within which gold’s price had been consolidating ever since forming a double-top reversal pattern back in Sep ‘11, was negated when the price crossed above the 1640 level. The long-term bull market in gold has resumed.
Technical indicators are looking bullish. MACD is above its signal line, and has climbed up into the positive zone. RSI is above its 50% level. Slow stochastic is inside its overbought zone. On the upside, resistance can be expected from the 1800 level. On the downside, the top of the descending triangle should provide support at about 1640.
Silver Chart Pattern
In an update two weeks ago about silver’s price chart pattern, the following remarks were made: “On the longer-term weekly chart (not shown), silver’s price has crossed above its 20 week EMA but is facing resistance from its 50 week EMA.”
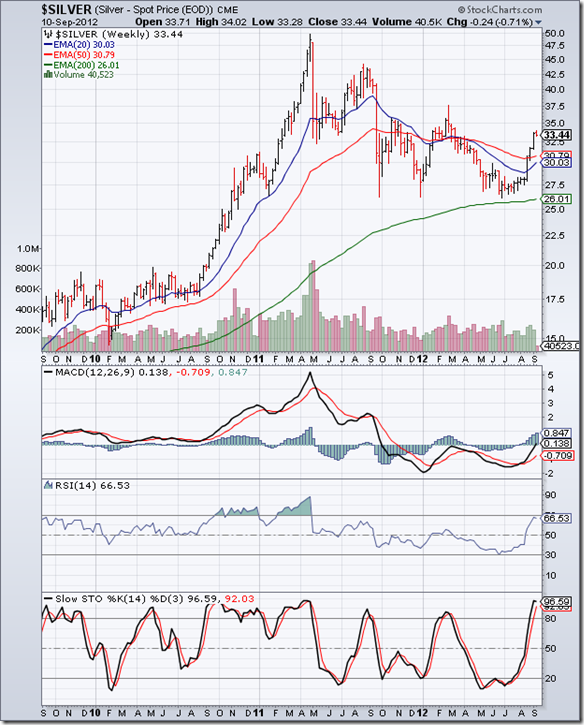
The 3 years weekly bar chart pattern of silver shows that resistance from the 50 week EMA was overcome quickly, accompanied by good volumes. By crossing above the 31 level, the large descending triangle bearish pattern, within which silver’s price was consolidating since the peak touched in Apr ‘11, has been negated. Once the 20 week EMA crosses above the 50 week EMA, the long-term bull market in silver will resume in earnest.
Technical indicators are looking bullish. MACD is rising above its signal line, and has just entered positive territory. RSI is right below the edge of its overbought zone. Slow stochastic is inside its overbought zone. Resistance can be expected at 37.50 on the upside. Downside support should be provided by the top of the descending triangle at 31.
Use dips to add.


No comments:
Post a Comment