BSE Sensex index chart
A holiday-shortened trading week had no dearth of tension and excitement – both in the political arena and the stock market. There was initial euphoria in the market following a slew of FDI (Foreign Direct Investment) policy announcements made by the UPA government.
That got tempered by the uncertainty of whether the pullout by Mamata Banerjee’s TMC from the UPA alliance would weaken the stability of the government and force a rollback in policy announcements. For a change, the Prime Minister refused to give in to its ally’s pressure tactics – just as he had stood up to the Communist ally’s pressure tactics against the US Nuclear deal.
Friday’s (Sep 21 ‘12) drama of resignation by 6 TMC ministers and withdrawal of support to the UPA government turned out to be a damp squib. In anticipation, there was a 400 points jump in the Sensex.
The weekly bar chart of the Sensex is in an up trend – marked by the blue trend line - since touching its Dec ‘11 low. It has formed a bullish pattern of a higher bottom and a higher top, and touched a 52 week high of 18867. The ‘golden cross’ of the 20 week EMA above the 50 week EMA has technically confirmed a new bull market.
Weekly technical indicators are bullish, but beginning to look overbought. MACD is rising above its signal line in positive territory. ROC is positive and has crossed above its 10 week MA. RSI is just inside its overbought zone, where it doesn’t like to stay for long. Slow stochastic is well inside its overbought zone.
Is it a good time for investors to start buying? Any time is a good time to buy, if you have the money. But a better time to buy was back in Jun and Jul ‘12, when the Sensex formed a higher bottom and started rising. The upside risk increases when an index or stock touches a new 52 week high.
Note that the Sensex is very close to a strong resistance zone between 19000 and 19750. Some consolidation or correction can be expected before the resistance zone is overcome. With the pesky TMC out of the way, more big ticket reforms announcements may be in the offing. That will help to propel the Sensex past the resistance zone.
NSE Nifty 50 index chart
The FIIs are pouring in money – though its colour may be debatable. There is strong suspicion in various quarters that unaccounted for Indian money is round-tripping through Mauritius and Singapore channels.
Inflation remains high, and the hike in diesel price isn’t going to reduce it. Interest rates are also high. So is oil’s price. Exports have taken a hit due to the economic slowdown in Europe and USA. The government needs to do far more to curtail its fiscal deficit.
The economic environment is not yet conducive for a runaway bull rally. Some of the liquidity in the system was drained out by advance tax payments. Equity sell-off in several PSUs have been lined up. That will put further strain on liquidity. It may be better to be cautiously optimistic than being ecstatically bullish. In other words, be very selective about what kind of investments you make.
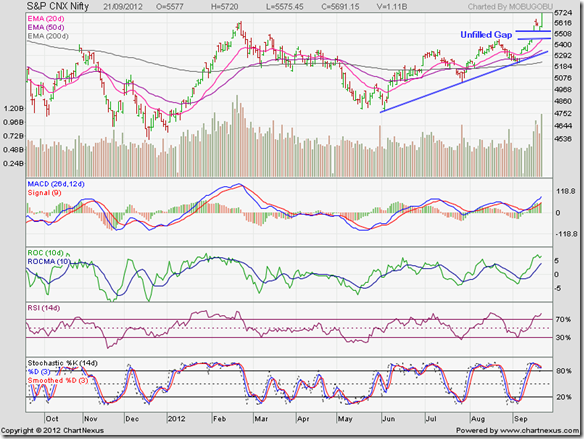
The shorter-term up trend in the daily bar chart pattern of the Nifty from the Jun ‘12 low remains intact. The 80 points gap formed on Sep 14 ‘12 was tested last week but not filled. If the gap remains unfilled in the days to come, or gets only partially filled, then it may turn out to be a ‘measuring gap’ with an upward target of about 6200 for the Nifty.
Technical indicators are bullish, but looking overbought. MACD is rising above its signal line in positive territory. ROC is positive and above its 10 day MA. RSI is inside its overbought zone. So is the slow stochastic. All four technical indicators failed to touch new highs as the Nifty rose to a new 52 week high. The negative divergences may lead to a correction or consolidation.
In last week’s analysis, it was mentioned that the band between 5700 and 5950 was a strong resistance zone. Nifty briefly entered the resistance zone on Friday before closing just below it. If a correction closes the unfilled gap, expect support from the 50 day EMA and the blue uptrend line (at about 5350).
Bottomline? Chart patterns of BSE Sensex and NSE Nifty 50 indices have entered new bull markets. Use dips to enter, but pick proven large-cap or mid-cap stocks/funds. Don’t forget to follow an asset allocation plan for your investments.


No comments:
Post a Comment