S&P 500 Index Chart
The 6 months daily closing chart pattern of S&P 500 index faced a bit of correction after testing its Apr ‘12 top. Such a correction is to be expected near a previous top, and improves the technical health of the chart. Note that the correction stopped short of the 1400 level and the rising 20 day EMA, indicating that bulls continue to hold the upper hand.
The entire rally during Aug ‘12 has been accompanied by falling volumes. For a bull rally to sustain, volumes should pick up – otherwise the index may succumb to the force of gravity. However, as long as the upward trend in the index is intact and its three EMAs keep on rising, there is no reason to get out of the market. Protect your profits with a suitable stop-loss.
Technical indicators are still in bullish zones, after correcting overbought conditions. MACD is positive, but has crossed below its signal line. RSI dropped down after facing resistance from the edge of its overbought zone, but is above its 50% level. Slow stochastic has fallen sharply from its overbought zone, but hasn’t crossed below its 50% level yet.
The index seems to have priced in some form of QE3. If status quo is maintained by the Fed, the index may correct some more. There is also a possibility – however remote – of a double-top reversal of trend. However, that can happen only if the index falls below its Jun ‘12 low.
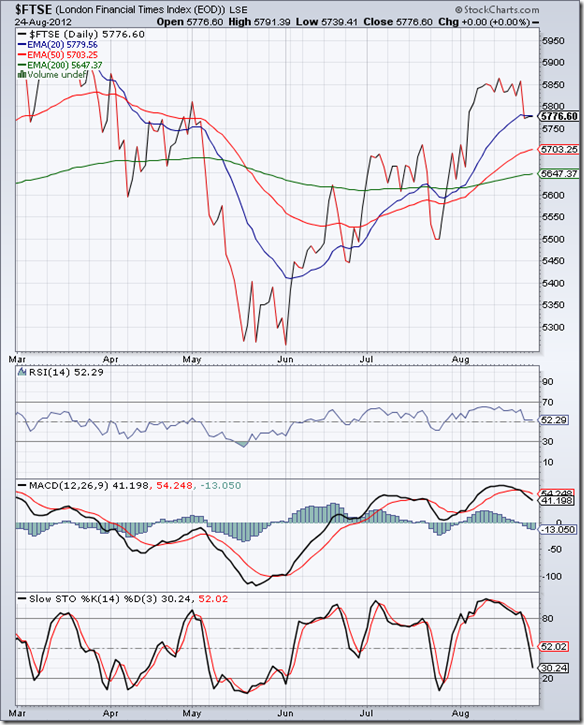
FTSE 100 Index Chart
In last week’s analysis, the 6 months daily closing chart pattern of the FTSE 100 index was consolidating near the 5850 level, and was struggling to move higher. Technical indicators had shown slowing upward momentum, and a correction was expected at any time.
The index dropped to its 20 day EMA mid-week, and then clung on to the short-term moving average for the rest of the week. The up trend from the Jun ‘12 low is still intact, but a further drop below the 50 day EMA can change bullish equations.
Technical indicators are beginning to look bearish. MACD is positive, but has formed a bearish rounding-top pattern to cross below its signal line. RSI is barely above its 50% level. Slow stochastic has fallen like a stone from its overbought zone, and looks ready to drop into its oversold zone.
Bottomline? Chart patterns of S&P 500 and FTSE 100 indices have corrected after testing their Apr ‘12 tops. Both indices are in bull markets – so upward bounces from current levels, if supported by rising volumes, can be adding opportunities. However, US and UK economies are still stuck in slow-growth mode. Both indices have rallied for three months and gained more than 10% from their Jun ‘12 lows. Partial profit booking may not be a bad idea.


No comments:
Post a Comment