Three weeks back, the Taiwan TSEC index had slipped into a bear market. The Hang Seng and the KOSPI were trading below their 200 day EMAs but technical confirmation of bear markets (viz. ‘death cross’ of the 50 day EMA below the 200 day EMA) were still awaited.
Brief forays into bull territories by all three indices have now ended. The bears are clearly ruling the charts. Tests and possible breaches of their respective lows – touched in Oct/Dec ‘11 – are likely. All three indices dropped steeply, followed by dead-cat bounces. Down moves have resumed.
Hang Seng index chart
The Hang Seng index chart in May ‘12 had “the best of times and the worst of times” (with due apologies to Dickens). A gap-up opening above all three EMAs on May 2 was followed by a very high volume day when the index closed lower. That was a sign of buying exhaustion. A sharp drop below the 19000 led to a brief technical bounce. The month ended with a high volume day and almost 12% lower monthly close.
The technical indicators briefly corrected oversold conditions, but are very bearish. MACD is negative and below its signal line. ROC is also negative. Slow stochastic is well inside its oversold zone. RSI has just emerged from its oversold zone. Doesn’t look like the bulls have any energy left to fight back.
Taiwan TSEC index chart
The Taiwan TSEC index was below its three EMAs and struggling to cling on to the 7500 level three weeks ago. After a steady fall, the index tested support from the 7000 level, bounced up smartly but faced strong resistance from the falling 20 day EMA. The bears struck hard today as the index dropped almost 200 points to close slightly above 7100.
The technical indicators are still bearish – after correcting oversold conditions. MACD is negative and barely above its signal line. ROC is also negative, after a failed attempt to enter positive territory. Both RSI and slow stochastic are climbing towards their 50% levels. The bears used the short bounce to resume selling.
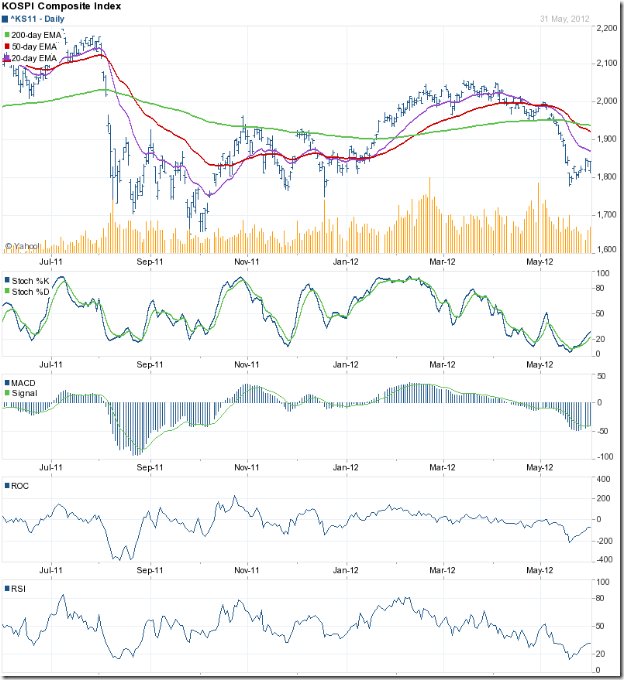
Korea KOSPI index chart
The Korea KOSPI index dropped like a stone below the 1800 level, bounced up and made a decent recovery above the 1850 level but ran out of steam before reaching the falling 20 day EMA. The index formed a bearish ‘flag’ pattern, and has already broken down below the pattern.
The technical indicators corrected oversold conditions – but remain bearish. MACD is negative and touching its signal line. ROC started climbing up towards its ‘0’ line, but stopped well short. Both RSI and slow stochastic have emerged from their oversold zones, but their momentum is slowing.
Bottomline? Chart patterns of the three Asian indices are back in bear markets. This isn’t the right time to start bottom fishing, as lower levels are expected. Start preparing a ‘buy’ list but wait for the trend to reverse before entering.


No comments:
Post a Comment