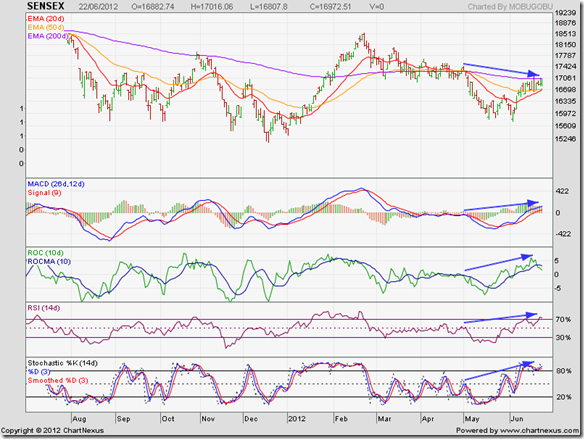
BSE Sensex index chart
There was bad news and not so bad news for the stock market last week. RBI’s hands-off action on interest rates and CRR came as a negative surprise. The Sensex formed a ‘reversal day’ pattern and dropped to its 50 day EMA on Monday, Jun 18 ‘12.
Greece’s election results didn’t turn out as bad as expected. A break-up of the Eurozone has been avoided for now, but Greece’s sovereign debt problem is far from getting resolved. India’s pledge of $10 Billion to IMF’s Eurozone bailout fund evoked caustic comments from many analysts, but was actually a smart and politically correct move.
US Fed’s extension of ‘Operation Twist’ (shorter-term bonds replaced by longer-term bonds) was a decent compromise, though some market analysts were expecting a QE3.
Sensex is knocking at the doors of its 200 day EMA, but has not been able to cross above convincingly. But looks like it is just a matter of time before it enters bullish territory.
All four technical indicators are showing positive divergences by touching higher tops while the Sensex reached a lower top (marked by blue arrows). The 20 day EMA and the signal line of MACD have formed bullish rounding bottom patterns.
Technical indicators are bullish, but showing signs of slowdown in upward momentum. MACD is rising above its signal line in positive territory, but the histogram is falling. ROC is positive, but has dropped below its 10 day MA. RSI and slow stochastic are in their overbought zones.
A slow grind upwards is more likely than a runaway rally. Sensex needs to move above its Feb ‘12 top of 18524 to form a bullish pattern of higher bottoms and higher tops. Bears may put up a good fight to stop that from happening.
NSE Nifty 50 index chart
Our soon-to-become-former FM was known to be close to former-PM Indira Gandhi, who had socialist leanings. Now that he will be ‘kicked upstairs’ and the RBI has returned the economic ball back to the court of the government, one can expect some market-friendly reform announcements. Whether such announcements turn into concrete actions on the ground or not may decide the trend of the stock market.
After spending four weeks below the down trend line, the weekly bar chart of the Nifty has completed three weeks above it. The last hurdle on the up move is the 50 week EMA. Once the 20 week EMA crosses above the 50 week EMA, a return to a bull market will be confirmed technically.
Technical indicators are showing signs of strength, but haven’t turned bullish yet. MACD is rising, but remains below its signal line in negative territory. ROC has crossed above its 10 week MA, but is still negative. RSI has emerged from its oversold zone, but is below its 50% level. Slow stochastic has climbed out of its oversold zone to reach its 50% level.
Why is the Nifty not crashing despite all the bad news and pessimism? One reason may be the current composition of the index. Many high-flying growth stocks which have not been performing well for the past four years have been replaced by more stable and defensive stocks. That has protected the down side.
Bottomline? Chart patterns of BSE Sensex and NSE Nifty 50 indices seem ready to cross above important resistances into bull territory. Enter slowly, and choose only fundamentally strong large-cap companies. But beware of a bull trap. Keep suitable stop-losses. Dollex and Defty charts are looking weak – thanks to the fall in the value of the Rupee.


No comments:
Post a Comment