S&P 500 Index Chart
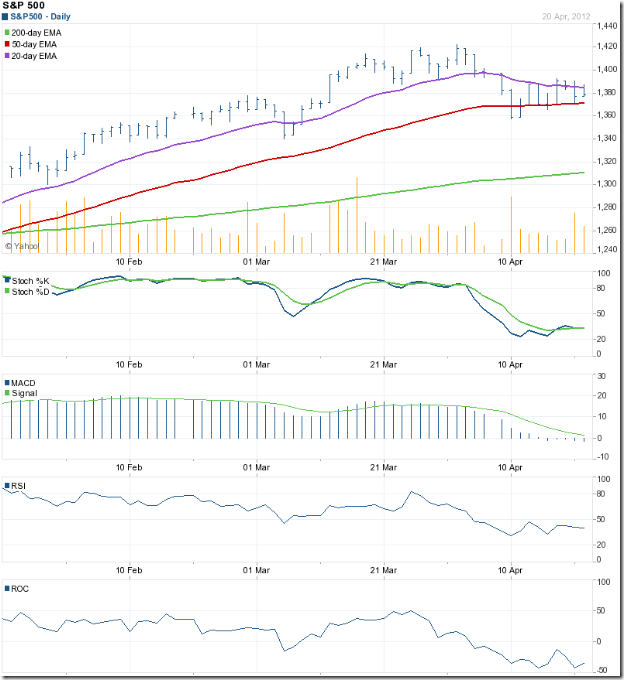
The 3 months bar chart pattern of the S&P 500 index shows consolidation within a symmetrical triangle for the past two weeks, after correcting from the peak of 1422 reached on Apr 2 ‘12. Triangles tend to be continuation patterns, which means that the likely break out will be below the triangle. But triangles are quite unreliable, so it may be better to wait for the break out.
Can the S&P 500 fall a lot? It seems unlikely at this stage. Note that the 200 day EMA is rising and the index is trading well above its long-term moving average. No need for bulls to panic. The 1340 level had acted as a support in Feb and Mar ‘12. The Jan 26 ‘12 top of 1333 is another support level. The downward target from the symmetrical triangle is also around 1340.
The technical indicators are bearish and supporting a likely break below the triangle. The slow stochastic and the RSI are both below their 50% levels. The MACD is below its signal line and has entered the negative zone. The ROC is close to its oversold level of –50.
A drop below the support zone of 1333 – 1340 will form a bearish pattern of lower tops and lower bottoms, which can open the doors to a deeper correction.
FTSE 100 Index Chart
The 3 months bar chart pattern of the FTSE 100 index shows a spirited fight back by the bulls, but to no avail. The 200+ points rally from the intra-day low of 5576 (on Apr 11 ‘12) to the intra-day high of 5792 (on Apr 19 ‘12) failed to cross the resistance of the falling 50 day EMA. The index continues to trade in a bearish pattern of lower tops and lower bottoms and should resume its down trend.
The technical indicators are still bearish, but showing some signs of a turn around. The slow stochastic has risen from its oversold zone but is yet to cross the half-way mark of 50%. The RSI has just managed to get its nose above the 50% level. The MACD has crossed above its signal line, but is inside the negative zone. The ROC found strong resistance from the ‘0’ line and is falling deeper into negative territory.
Technically a bear market has not been confirmed yet, but things are not looking good for the bulls.
Bottomline? Chart patterns of the S&P 500 and FTSE 100 indices are still under bear attacks. The bulls are still in reasonably good shape in the US market. But the bears are gaining ground in the UK market. Stay on the sidelines and let the corrections play out.


No comments:
Post a Comment