S&P 500 Index Chart
In last week’s analysis of the S&P 500 index chart pattern, the technical indicators were looking bullish and the 20 day EMA had crossed above the 200 day EMA. The 50 day EMA has just crossed above the 200 day EMA – for the first time since Aug ‘11 – but the cross hasn’t been a convincing one yet. The ‘golden cross’ (of the 50 day EMA above the 200 day EMA) confirms a return to a bull market.
A little more work remains to be done by the bulls. The Oct ‘11 intra-day top of 1293 has to be surpassed to form a bullish pattern of higher tops and higher bottoms. There are a couple of technical concerns. Volumes have not been that great. The technical indicators are showing some signs of being overbought.
The slow stochastic is inside the overbought zone. The RSI is about to enter its overbought zone. The MACD is positive and rising above its signal line. The ROC is rising in positive territory. These are bullish signals. But there is a tendency to hesitate near a previous top (or bottom).
The US economy is returning to the growth path – albeit slowly. Initial unemployment claims came in lower at 372,000. Non-farm private sector employment rose to 325,000 in Dec ‘11 from 204,000 in Nov ‘11. Part of the rise can be attributed to holiday season part-time hires. The Jan ‘12 employment figures will reveal the true picture. AAII’s survey of individual investors showed bullish sentiment at an 11 month high of 48.9%, and bearish sentiment at a year low of 17.2%.
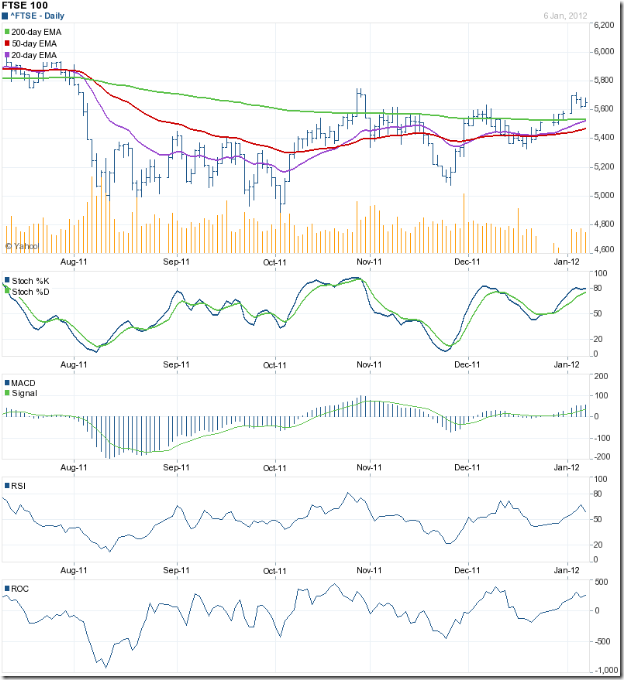
FTSE 100 Index Chart
The FTSE 100 index chart is trying to follow in the footsteps of the S&P 500 index by trading above its 200 day EMA – but is a few steps behind. Note that both the 20 day EMA and 50 day EMA are still below the 200 day EMA, though the 20 day EMA may cross above the long-term moving average soon.
Volumes are on the lower side, which puts a question mark on the sustainability of the current rally. The Oct ‘11 intra-day high of 5747 needs to be crossed. The technical indicators are showing signs of weakness. The slow stochastic is at the edge of its overbought zone, and moving sideways. The RSI is dropping towards its 50% level. The MACD, which is a lagging indicator, is rising above its signal line in positive territory. The ROC is also positive, but its upward move has stalled.
The UK economy continues to lag the bullish stock index. Retail sales during the recent holiday season were not up to the mark. This could lead to more job losses as businesses downsize to survive. Stronger-than-expected growth in the dominant services sector last month may have saved the UK economy from contraction in the final quarter of 2011, as per this article. The December PMI figure was 49.6, up from the 47.7 recorded in November, but still below the 50 mark that signals growth.
Bottomline? Chart patterns of the S&P 500 and FTSE 100 indices appear poised to return to bull markets, despite the sluggish growth (or, lack of it) in the US and UK economies. However, every silver lining has a dark cloud. Both indices appear to be forming bearish ‘rising wedge’ patterns from their Nov ‘11 lows, which could lead to downward breaks and retreats back to bear markets. So, caution is advised till the Oct ‘11 tops are convincingly surpassed.


No comments:
Post a Comment