The chart patterns of the Asian indices, last analysed three weeks back, are showing clearly diverging moves. The Hang Seng index is moving sideways in a bear market; the Straits Times index is sliding down in a bear market; the KLCI Malaysia index is climbing up in a bull market.
Hang Seng Index Chart
Since touching an intermediate top at 20173 in Nov ‘11, the Hang Seng index has been consolidating sideways within a symmetrical triangle pattern. The index is trading well below its falling 200 day EMA, so the logical break out of the triangle should be downwards. But triangles can be unpredictable. The index may break out upwards or continue to trade sideways.
The technical indicators are bullish, but showing signs of weakness. The MACD is above its signal line and trying to enter the positive zone. The ROC is positive and above its 10 day MA, but turning down. The RSI is above its 50% level, but its upward movement has stalled. The slow stochastic has dropped down from its overbought zone.
A break below the triangle could lead to a test of the Oct ‘11 low.
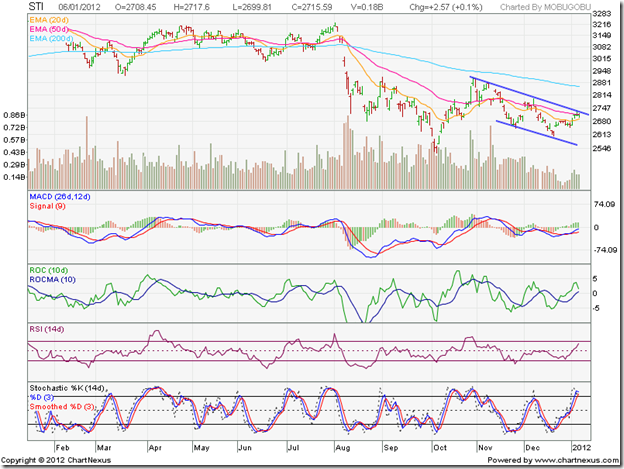
Singapore Straits Times Index Chart
The Singapore Straits Times index is in a bear market, and has been trading within a downward-sloping channel for the past couple of months. Note the falling volumes, which is typical in down trends.
The technical indicators are giving contrasting signals. The MACD is rising above its isgnal line, but is still in negative territory. The ROC is positive and above its 10 day MA, but has turned around sharply. The RSI has climbed towards its overbought zone. The slow stochastic has already entered its overbought zone.
The index may make another attempt to cross above the downward channel. Whether it will be successful or not is a moot point.
Malaysia KLCI Index Chart
The KLCI Malaysia index appears to have shaken off the bears as it climbed above all three EMAs. The index is trading within an upward-sloping channel. The 20 day EMA has crossed above the 200 day EMA. The 50 day EMA is all set to follow suit – the ‘golden cross’ will confirm a return to a bull market.
The bears have not been vanquished yet. Note the progressively lower volume peaks as the index has moved up. There are negative divergences visible in the MACD and ROC, which failed to touch higher tops with the index. The technical indicators are correcting from overbought conditions.
A drop to the lower edge of the channel is a possibility, but the up trend may not get reversed.
Bottomline? The three Asian index chart patterns are moving in three different directions. The Hang Seng index is consolidating within a triangle; await the break out. The Singapore Straits Times index is in a down trend; sell the rallies. The KLCI Malaysia index is in an up trend; buy the dips.


No comments:
Post a Comment