In the analysis of the chart patterns of the Hang Seng, Straits Times and Malaysia KLCI indices two weeks back, the following conclusion was drawn:
‘All three Asian indices are deep within bear markets, and heading further south. Neither the fundamental nor the technical outlooks are rosy. Bide your time to enter at lower levels.’
All three indices did drop lower in the first week of Oct ‘11, but interestingly the Malaysia KLCI index reached a higher bottom, while its two Asian neighbours touched new lows.
Hang Seng Index Chart
In the previous post on Sep 30 ‘11, it was pointed out that the gap in the Hang Seng chart between 18700 and 18300 was a ‘measuring gap’ with a downward target of 16000. The index dropped to a new intra-day low of 16170 on Oct 4 ‘11. Since bear market targets tend to fall a little short (while bull market targets usually overshoot), the downward target of 16000 may be considered as met.
Note that the ROC, the RSI and the slow stochastic did not drop to new lows while the Hang Seng dropped lower. The positive divergences hinted at a rally that has not only propelled the index above its 20 day EMA, indicating short-term strength, but has closed the ‘measuring gap’ as well.
The receding volumes during this week is an indication that the rally is losing momentum. The technical indicators are giving mixed signals, hinting at a period of consolidation. The MACD is rising above its signal line, but remains negative. The ROC is positive and well above its rising 10 day MA, but has turned down. The RSI has climbed above its 50% level, which is a bullish sign. The slow stochastic has entered its overbought zone, from which has turned back quickly in the past four occasions.
Singapore Straits Times Index Chart
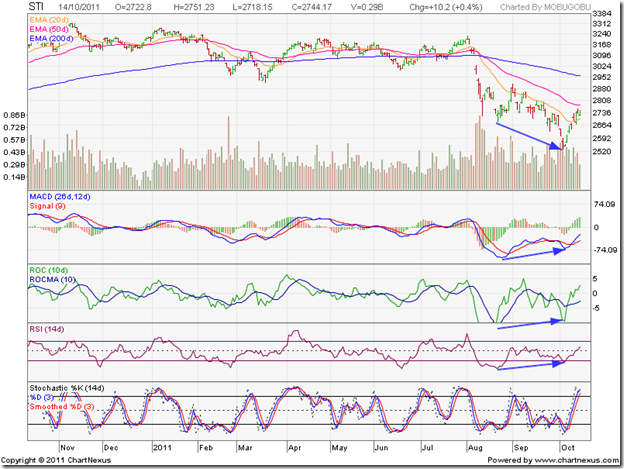
The Straits Times index dropped to a new low of 2522 on Oct 5 ‘11, but the MACD, the ROC and the RSI touched higher bottoms (marked by blue arrows). The positive divergences preceded a sharp rally that crossed the 20 day EMA as expected, and almost reached the falling 50 day EMA. A small ‘reversal day’ pattern on Oct 13 ‘11 supported by good volumes appears to have brought the rally to a temporary halt.
The Singapore index closed higher today, but made a lower top and lower bottom bar. Volumes were much lower as well. The technical indicators are looking bullish. The MACD is rising above its signal line in negative territory. The ROC has climbed into positive territory and is above its 10 day MA. The RSI has moved above the 50% level. The slow stochastic has entered its overbought zone. A test of resistance from the 50 day EMA may be in the offing.
Malaysia KLCI Index Chart
What had appeared to be a ‘dead cat bounce’ in the chart pattern of the Malaysia KLCI index turned into a sharp rally from the Sep ‘11 low of 1310, correcting almost 48% of its fall from the Jul ‘11 peak of 1597. The index crossed and closed above the 50 day EMA, which is a bullish sign, but the proximity to the 50% Fibonacci retracement level of 1453 may have encouraged the bears.
The index formed a ‘reversal day’ pattern today, which could mean the end of the three weeks long rally. The technical indicators are looking overbought, which is usually a precursor to a correction. The MACD is still negative, but has moved far above its rising signal line. The ROC rose too quickly above its 10 day MA, and its up move has stalled. The RSI has moved up almost vertically into its overbought zone. The slow stochastic is well inside its overbought zone.
Bottomline? All three Asian indices have risen sharply from their recent lows. Such sharp rallies are often seen in bear markets. As long as the indices trade below their falling 200 day EMAs, the bear markets will remain in force, and the strategy should be to sell the rallies. The first signal of a trend reversal will be the crossing of the 20 day EMA above the 50 day EMA. So keep a watch on the short-term and medium term moving averages.


No comments:
Post a Comment