Gold Chart Pattern
In an update to gold’s chart pattern two weeks ago, the following conclusion was drawn:
‘The present correction/consolidation – whatever it may turn out to be – should restore the technical health of gold’s chart for the next up move.’
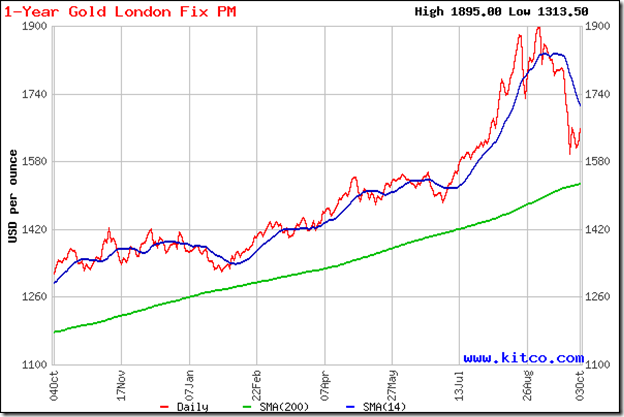
The expected drop to 1600 from the double-top at 1900 happened quickly, and gold’s price has been consolidating in a narrow range of $50 since then. It is beginning to look like the next up move may take a while, and gold’s price may dip further – possibly to the 200 day SMA (at about 1520) - before a sustained rise can begin again.
Note that the 200 day SMA is still rising, with gold’s price trading above the long-term moving average. Technically, gold is still in a bull market. But extreme caution is advised about entering at this stage – since the yellow metal is trading below its 14 day, 30 day and 60 day SMAs. All three are likely to act as resistances on any up moves. Not to forget the valley level of 1750 (between the two tops at 1900), which should provide strong resistance to a price rally.
A fall below the 200 day SMA will also mean a 20% drop from its peak, and a likely trend reversal from bull to bear. If you are still holding and in profit, maintain a strict stop-loss at 1520.
Silver Chart Pattern
There are no doubts about the state of silver’s price chart pattern – it is in a bear market. It has dropped more than 20% from its peak and is trading below the 200 day SMA. The 14 day SMA has slipped below the long-term moving average. The 30 day and the 60 day SMAs have turned down and may cross below the 200 day SMA in the near future.
Why is silver faring worse than gold? The answer probably lies in the fact that silver is not something you just buy and lock up in a bank vault. It has several industrial uses as well. With global manufacturing in clear de-growth, industrial demand for silver is declining. (The fall in copper prices are also due to this same reason.)
If you are still holding, use any price rise to exit. On the down side, the next supports are at 24 and 20.


No comments:
Post a Comment