S&P 500 Index Chart
After the steep fall in the S&P 500 index chart in the previous week, I had made the following comment in last week’s analysis: “Such sharp falls are usually followed by an upward bounce. If you are still invested, use the likely bounce to exit.”
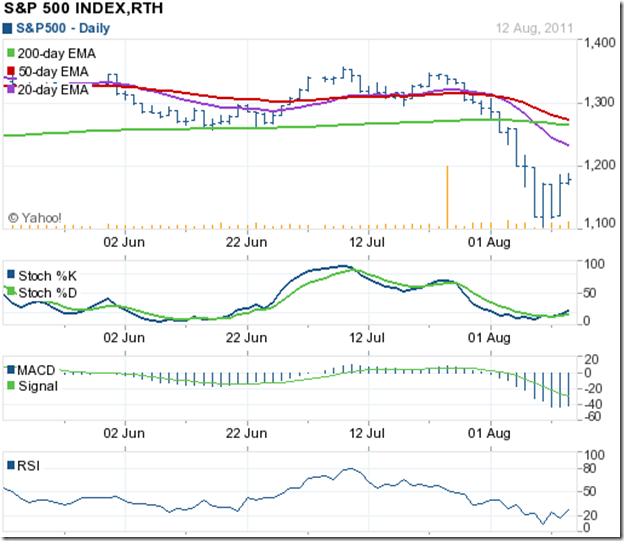
The bounce was expected, but not the extent of volatility. The index bounced up and down like a yo-yo, but managed to stay above the long-term support level of 1100. The index lost 20 points (1.7%) on a weekly basis.
The technical indicators are reversing from oversold conditions. Both the slow stochastic and the RSI have emerged from their oversold zones. The MACD is below its signal line in negative territory, but has started rising. The S&P 500 is likely to regain more lost ground this week, but it may be more of a selling opportunity.
The falling 20 day EMA may resist any up move, with stronger resistance expected from the 1250 level and the 200 day EMA. The 50 day EMA is about to cross below the 200 day EMA. At last week’s intra-day low of 1102, the S&P 500 dropped almost 20% from its May ‘11 peak. A bear market is looming.
The economy is faring better than this time last year, but not by much. Corporate earnings have been good and valuations look attractive, but hiring is tepid; initial unemployment claims was just below the 400,000 mark; retail sales in July rose by about 0.5% – its biggest gain in 4 months; AAII survey of bullish investor sentiment rose from 27.2% to 33.4%. But Univ. of Michigan Consumer Confidence index fell to 54.9 from 63.7 in July – its lowest level since 1980.
FTSE 100 Index Chart
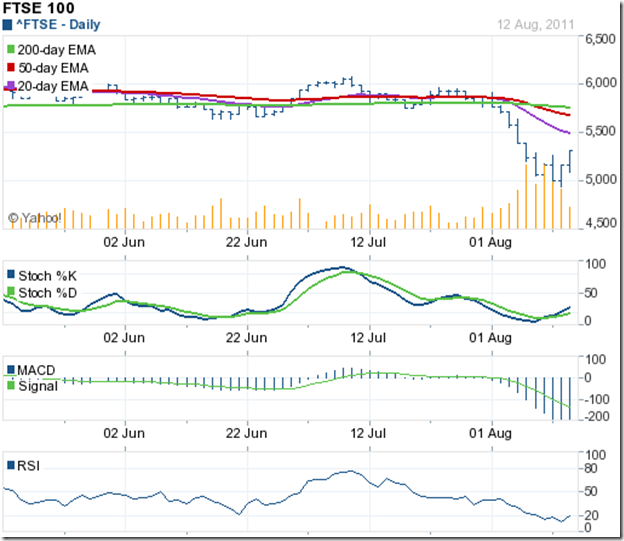
A volatile week of trading, during which the FTSE 100 index chart dropped well below the 5000 level intra-day (Aug 9 ‘11) on strong volumes, ended with the index bouncing up to close above the 5300 mark – gaining 73 points (1.4%) on a weekly basis. That was the good news.
Friday’s (Aug 12 ‘11) bounce up was on the lowest volumes of the week – a bearish sign. What is worse is that the at its intra-day low of 4791 on Tue. Aug 9 ‘11, the FTSE dropped more than 20% below its May ‘11 top. The ‘death cross’ of the 50 day EMA below the 200 day EMA has confirmed a bear market.
The technical indicators are trying to correct from oversold conditions. The slow stochastic has emerged from its oversold zone. The RSI is still struggling to do so. The MACD is below its signal line in negative territory, but has stopped falling. A further up move is likely to face resistance from the 5600 level and the three falling EMAs.
The UK economy is struggling. Unemployment is going up. Real incomes fell last year for the first time since 1981 and are on course to fall again this year. Consumer confidence has slumped to levels seen in the depths of the recession. High street retailers are sending out profit warnings.
Bottomline? The S&P 500 chart is on the verge of falling into a bear market. The FTSE 100 chart has already entered a bear market. High volatility is a sign of uncertainty – and points to a deeper correction. Time to stay on the sidelines, and wait for better buying opportunities.


No comments:
Post a Comment