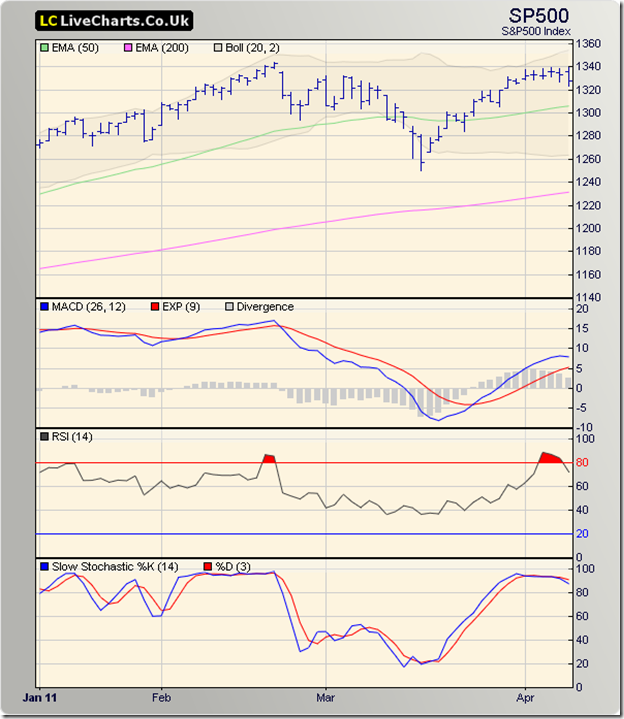
S&P 500 Index Chart
The 1340 level proved to be a strong resistance during the past week for the S&P 500 index chart. It failed to test the Feb ‘11 top of 1344, consolidated sideways, and closed the week marginally lower. Hesitation near a previous top was expected.
The technical indicators are showing signs of fatigue. The MACD is positive and above its signal line, but is turning down. The RSI rose quickly into the overbought zone, but has started correcting. The slow stochastic is still in its overbought zone, and hinting at a correction. Further consolidation, and may be another drop towards the rising 50 day EMA is possible.
Employment growth remains weak, probably due to rising productivity and profits in corporate America. Why hire, when the existing employees are working harder! As per this article, consumer sentiment is directly correlated with job growth. The question is: What will happen when QE2 is withdrawn? Will the economy start contracting? More importantly for equity investors, will the markets crash?
FTSE 100 Index Chart
The bull rally in the FTSE 100 index chart crossed an important hurdle by closing above the Mar ‘11 top of 6052, with another weekly gain. Friday’s higher close was on lower volumes. The Feb ‘11 top of 6106 needs to be conquered before the bulls can regain complete control. Note that the Bollinger Bands are widening – a sign of increasing price volatility.
The technical indicators are looking overbought. The MACD is above its signal line and rising in positive territory. The RSI is inside its overbought zone, where it doesn’t like to spend much time. The slow stochastic seems well entrenched in its overbought zone. A bit of correction or consolidation may provide the impetus to the bulls to take the index to a new high.
Bottomline? The chart patterns of the S&P 500 and FTSE 100 indices are facing some technical headwinds. A correction or consolidation is likely. Both indices are in bull markets, so stay invested and buy the dips.


No comments:
Post a Comment