The weekly charts of the BSE Sectoral Indices, since the bull market began in Mar ‘09, provides a long-term perspective of the broader market. Most sectors have broken out of their down trends, but are yet to reach new highs. A couple of sectors are in long consolidation patterns. Two sectors are struggling in bear markets.
BSE Auto Index
The BSE Auto index breached its down trend line earlier this month after oscillating about its 50 week EMA for a few weeks. It is gradually rising above its 20 week and 50 week EMAs. The technical indicators are looking bullish, but hinting at a pull back to the trend line. That would be a buying opportunity.
BSE Bankex
The BSE Bankex moved above its down trend line in Mar ‘11, but the subsequent up move above its two EMAs has been gradual. The technical indicators are bullish, but showing signs of weakness. A drop to the 20 week or 50 week EMA is possible. The dip can be a buying opportunity.
BSE Capital Goods Index
The BSE Capital Goods index broke above its down trend line earlier in Apr ‘11, but pulled back immediately. The blue down arrow indicates the ‘death cross’ of the 20 week EMA below the 50 week EMA. Unless the index can sustain above its 50 week EMA, the bulls will be under pressure. Technical indicators are giving mixed signals, which means the correction may continue for a while. Hold.
BSE Consumer Durables Index
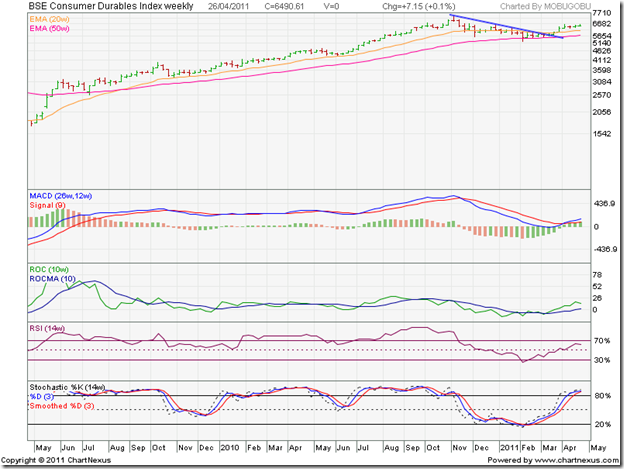
The BSE Consumer Durables index has been one of the better performers. It didn’t close below its 50 week EMA even for a single week, and convincingly breached the down trend line in Mar ‘11. Technical indicators are bullish. Dips can be bought.
BSE FMCG Index
The BSE FMCG index has been a star performer. Note that after almost meeting the down side target from the triple top at 3800, the index has climbed sharply above both its EMAs. Technical indicators are bullish, and a breach of the previous high is likely. But one should be cautious near a previous top – particularly one that has provided strong resistance earlier. Hold.
BSE Healthcare Index
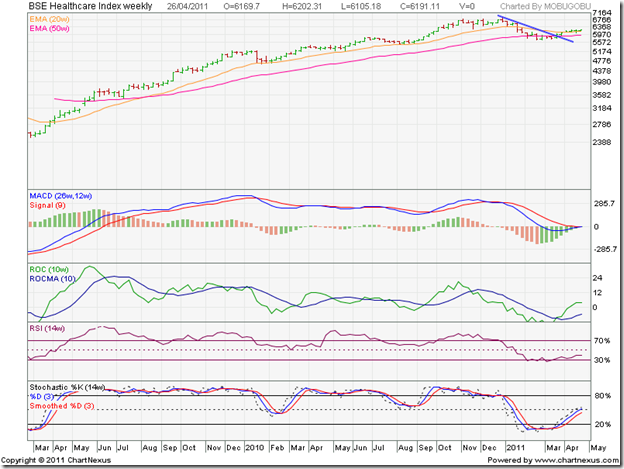
The BSE Healthcare index breached its down trend line in Mar ‘11, but has been consolidating sideways for four weeks. Technical indicators are mildly bullish, suggesting that the consolidation may continue. Hold.
BSE IT Index
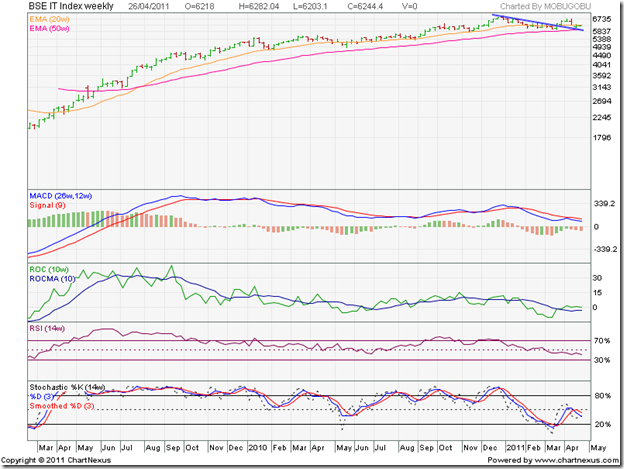
The BSE IT index remained above its 50 week EMA throughout the correction before comfortably breaching its down trend line last month. The pullback was equally sharp. Technical indicators are looking bearish. Time to book partial profits.
BSE Metal Index
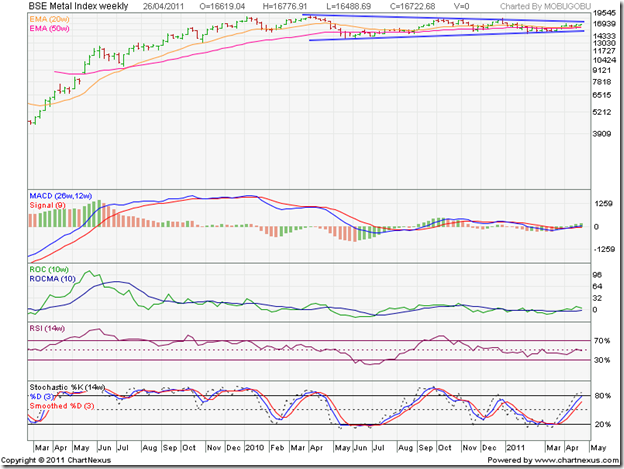
The BSE Metal index has been consolidating within a symmetrical triangle-like pattern for more than a year, alternately moving below and above its 50 week EMA. It spent the previous 5 weeks above its 20 week and 50 week EMAs, but the technical indicators are not supporting an immediate upside break out. Hold.
BSE Oil & Gas Index
The BSE Oil & Gas index has been consolidating within a slightly upward sloping channel for almost two years. The ‘death cross’ marked by the blue arrow was followed by a bounce from the lower edge of the trading channel. Technical indicators are showing signs of bullishness. If oil prices are raised following the state elections, the index may break out above the channel. Trade the channel, or wait for a break out to buy/sell.
BSE Power Index
There is no power in the BSE Power index chart. After consolidating within an upward sloping channel for 20 months, the index dropped out of the channel in Jan ‘11. It subsequently made a bullish rounding bottom pattern, but the up move lost steam after moving briefly above the falling 20 week EMA. Technical indicators are mildly bullish, but the index is below its falling 50 week EMA – the sign of a bear market. Avoid.
BSE Realty Index
The BSE Realty index remains at the bottom of the pack. It never really emerged from its long-term bear market of more than 3 years duration – despite spending several weeks above its 50 week EMA. Note that the 20 week EMA failed to convincingly rise above the 50 week EMA, which would have confirmed a bull market. Technical indicators are showing bullish signs, but the index remains within a downward sloping channel, and well below its falling 50 week EMA. Avoid.


No comments:
Post a Comment