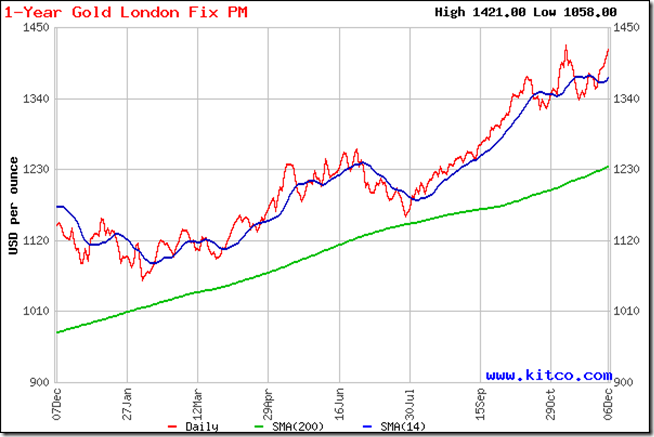
The one year gold chart pattern encouraged me to paraphrase an old proverb: You can’t keep a good commodity down. Nothing seems to be able to halt the impressive rise in gold prices. The debasement of the US dollar – thanks to the Fed’s busy money printing machines – has ensured a flight to safety that easily absorbed the IMF’s selling.
So, who has been doing the buying? Apparently every one whose name isn’t Warren Buffett or Rakesh Jhunjhunwala. But one of the biggest buyers in recent times has surprisingly been China. The government wants to protect the value of its huge trade surplus with the USA and its citizens’ fears of rising inflation. The head of the Shanghai Gold Exchange told a conference that Chinese imports of gold for 2010 through October were 209.7 tonnes, compared to 45 tonnes for the whole of 2009.
Why were gold experts surprised by Chinese buying? Because China happens to be one of the biggest producers of the yellow metal. India, which is one of the largest gold importers, has also stepped up its buying – thanks to the strengthening Rupee. Its imports are likely to be almost 50% more than last year, and is expected to hit the 700 tonnes mark.
No wonder the gold chart pattern continues its parabolic rise and has touched an all-time high once again. Time to take a look at the one year chart pattern of gold:
After reaching an all-time high of 1421 last month, the gold chart made a small, bearish head-and-shoulder pattern that more than met its down side target as gold’s price dropped steeply to 1340, a near 6% correction from the peak.
A smart upward bounce found resistance from the 14 day SMA and the chart seemed to form a larger bearish head-and-shoulder pattern. Before the price could fall to the upward sloping trend line, strong buying emerged and the falling 14 day SMA was pierced from below.
At the time of writing this post, gold’s price oscillated a bit near the previous high before moving up to touch a new all-time high of 1424, only to drop down to 1421 again. It seems only a matter of time before the 1500 mark will be surpassed.
Should investors jump in and start buying? Unfortunately, without volume data it is difficult to provide a clear ‘yes’ or ‘no’ answer. On the ‘yes’ side of the argument is the weight of the massive Chinese and Indian purchasing. On the ‘no’ side are two technical reasons – hesitation near a previous top and significant and widening distance between gold’s price and its rising 200 day SMA.
Prudence suggests that one should follow bull market tactics – i.e. buying on dips.

No comments:
Post a Comment